Enterprise B2B lead generation

We coordinated a sharper B2B demand system.

The customer came to us needing Google, LinkedIn, and Meta to serve different B2B buying journeys without losing measurement discipline. We audited the dashboards, separated every unit, and managed each channel against a specific commercial job. In the latest audited year, Google Ads reported 4.80× more primary conversion events on just 5.02% more spend.

  • Google Ads
  • LinkedIn Ads
  • Meta Ads
  • GA4 + GTM
The commercial brief One pipeline

Three different B2B buying contexts

We coordinated Channel roles

Intent, professional targeting, and social demand

The platforms recorded More activity

Every unit stayed platform-specific

We exposed The CRM gap

Volume was visible; qualification was not

The problem

Three dashboards. Three meanings of “lead.”

Google recorded conversion actions. LinkedIn and Meta recorded native lead-form results. GA4 recorded repeated form and demo events. Without a shared definition, more volume could still produce less commercial clarity.

01

Tracking gaps

Product demos, quote requests, contact actions, and partner journeys needed their own signals.

02

Channel overlap

Search intent, professional audiences, and social discovery could not share one campaign logic.

03

Quality blindness

Native platforms counted actions, but the supplied analytics did not return MQL, SQL, or opportunity stages.

What a surface dashboard says

“More leads”

What the business needs to know

“Which leads become pipeline?”

The system

We gave every channel one job.

We did not force three platforms into one playbook. We managed a full-funnel structure that matched channel strength to buyer intent—and matched campaigns to measurable next actions. The supplied files do not establish who first created every historical tag or campaign.

  1. 01

    Audit every signal

    We reviewed Google Ads, GA4, GTM, LinkedIn Ads, and Meta Ads before treating any dashboard number as a lead.

  2. 02

    Map the funnel

    We separated awareness, consideration, demo, quote, partner, and contact actions so decisions did not collapse into one blended bucket.

  3. 03

    Assign channel roles

    We used Google for intent, LinkedIn for professional targeting, and Meta for efficient audience expansion and native forms.

  4. 04

    Feed decisions back

    We split campaigns by audience and commercial intent, then shifted budgets, bids, creatives, and landing paths with the evidence.

TOFU

Create demand

Meta audiences, LinkedIn awareness, video, and creative testing introduced product categories to the right business segments.

MOFU

Shape consideration

Professional targeting, remarketing, product education, and audience layers moved active accounts toward a demo or inquiry.

BOFU

Capture intent

High-intent Search, demo forms, quote requests, and partner/contact paths converted demand into measurable actions.

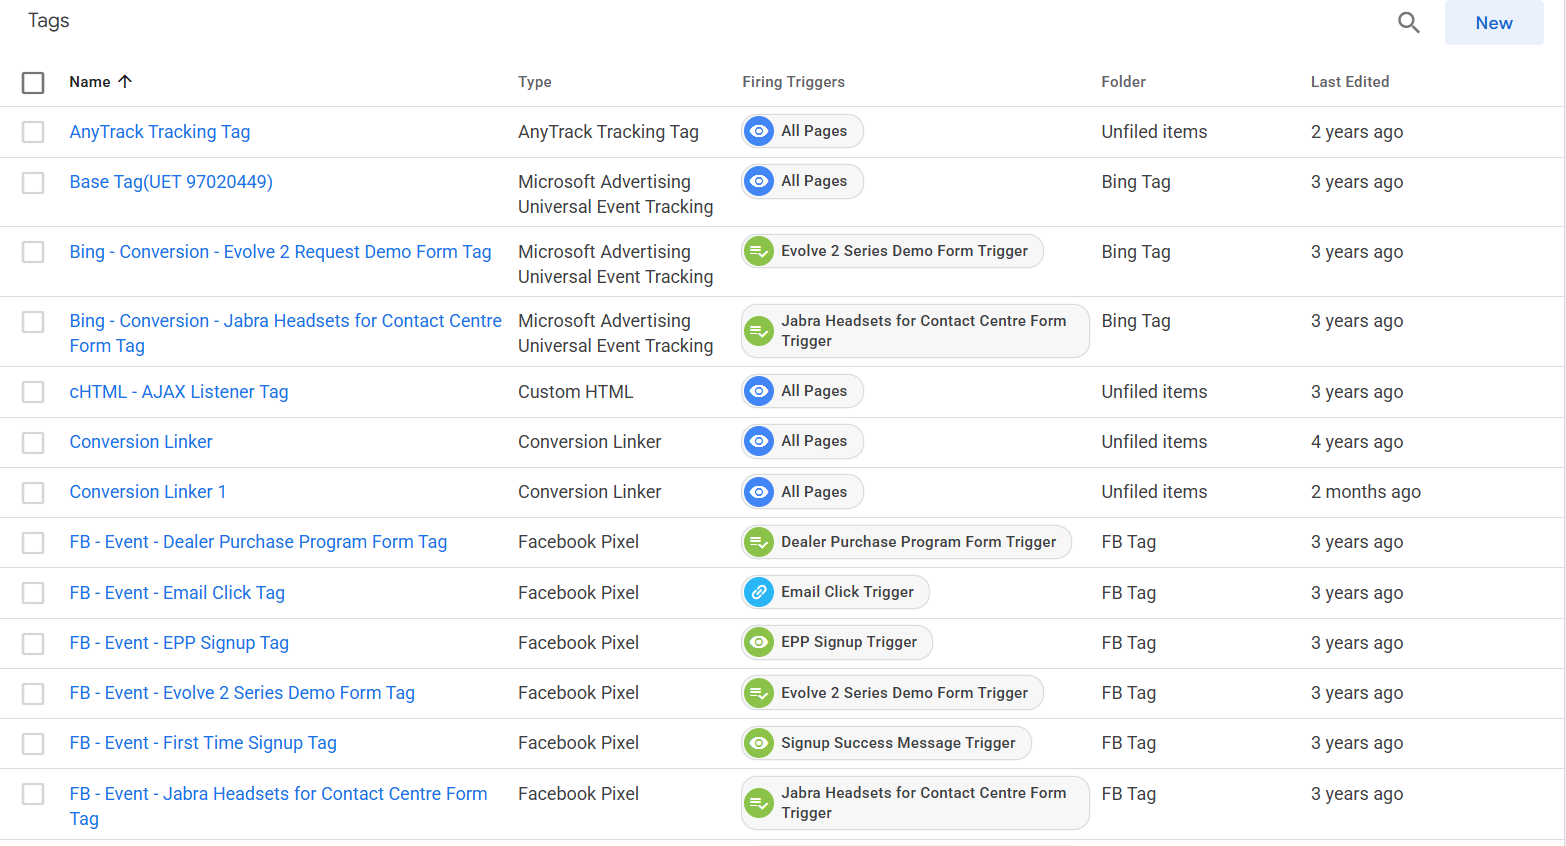
Google Tag Manager

We managed against a granular signal map

Full tag inventory · client name redacted

Full Google Tag Manager inventory showing measurement tags for multiple business-critical actions, with the client name redacted
The source container shows granular tags and triggers across product, contact, and funnel actions. It proves measurement depth—not CRM lead quality. We show the full source view and redact the client name in four places.

The evidence

The platforms recorded scale. We kept the definitions honest.

Every figure below stays inside its native platform and reporting window. That makes the result useful for decisions without pretending three attribution systems equal one deduplicated sales pipeline.

Google YoY spend +5.02%

INR 2.083M → INR 2.188M

Google reported events 4.80×

2,357.99 → 11,325.40

Google reported CPA −78.13%

INR 883.55 → INR 193.19

Meta campaign result +292.11%

447 vs 114 lead-form results

Why we do not call this “4.8× more qualified leads”: Google’s action mix changed materially across the comparison. The latest period contained more granular demo and lead-form actions. The growth is a valid platform-reported change, but no supplied CRM export can separate better performance, better visibility, repeat submissions, or duplicated people.

01

Google Ads

Capture active demand

11,325.40

reported primary conversion events

Investment / scope
INR 2.188M spend
Efficiency lens
INR 193.19 reported CPA

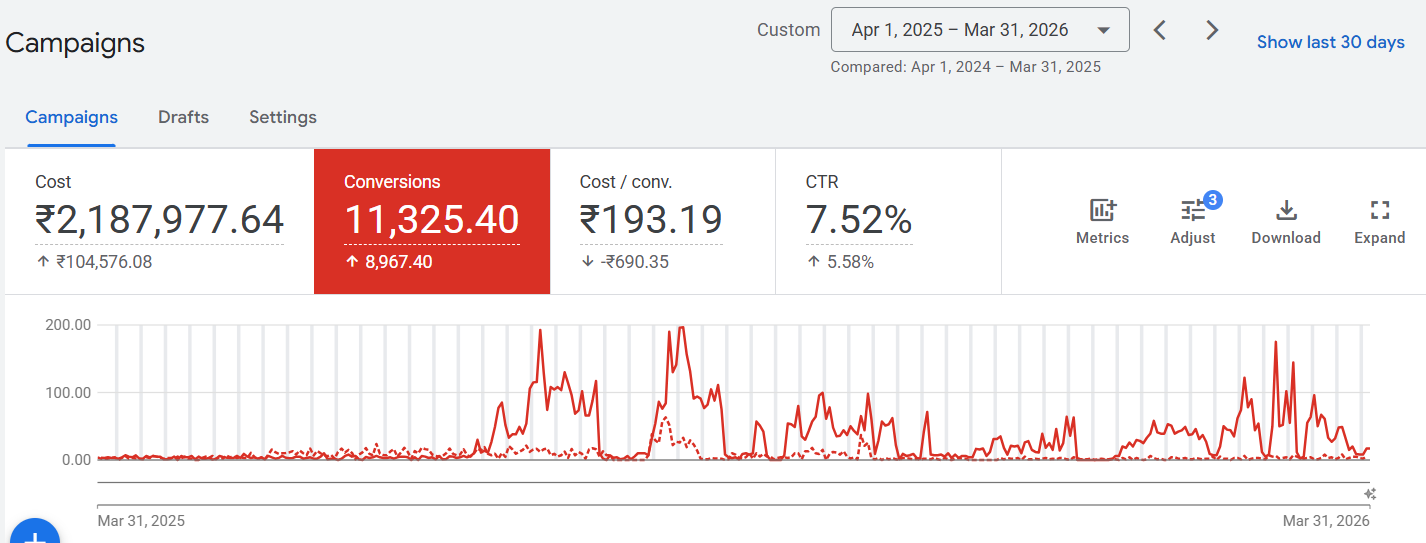
Apr 1, 2025–Mar 31, 2026. Of these events, 11,311.79 were categorized as lead-form or request-quote actions. They are attributed actions—not deduplicated or qualified people.

Actual Google Ads dashboard

Apr 1, 2025–Mar 31, 2026

Google Ads dashboard comparing April 2025 to March 2026 with the prior year, showing INR 2,187,977.64 cost, 11,325.40 conversions, INR 193.19 cost per conversion, and 7.52 percent CTR
Apr 1, 2025–Mar 31, 2026. Of these events, 11,311.79 were categorized as lead-form or request-quote actions. They are attributed actions—not deduplicated or qualified people.
02

LinkedIn Ads

Reach enterprise buyers

5,040

platform leads in one campaign family

Investment / scope
INR 4.393M campaign-family spend
Efficiency lens
INR 871.62 blended platform CPL

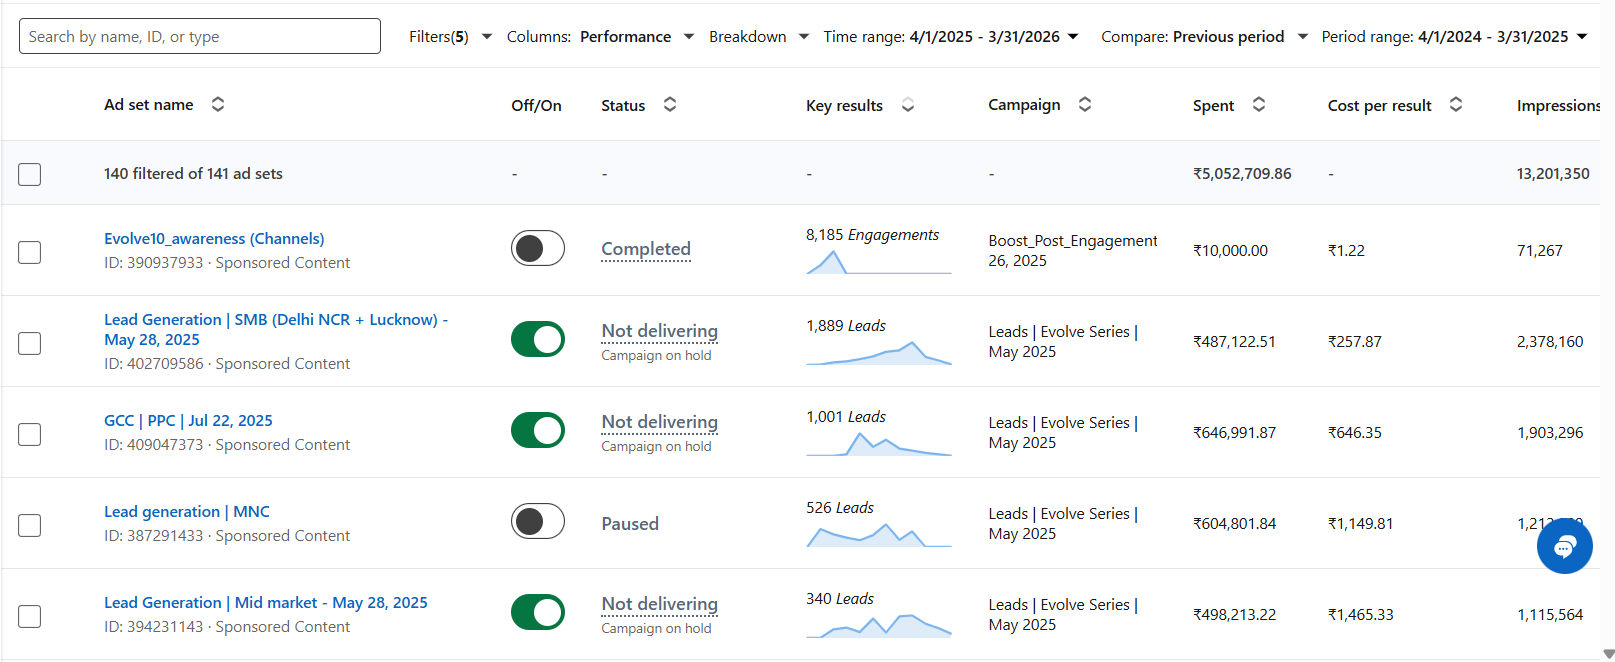
May 2025–Mar 2026. The structured LinkedIn report records this result for the Evolve Series lead campaign family. No supplied CRM export proves how many became MQLs, SQLs, or opportunities.

Actual LinkedIn Ads dashboard

Apr 1, 2025–Mar 31, 2026

LinkedIn Campaign Manager dashboard for April 2025 to March 2026 showing lead-generation ad sets, native lead results, spend, and cost per result
May 2025–Mar 2026. The structured LinkedIn report records this result for the Evolve Series lead campaign family. No supplied CRM export proves how many became MQLs, SQLs, or opportunities.
03

Meta Ads

Expand SMB and mid-market demand

447

lead-form results in one audited campaign

Investment / scope
INR 19,191.81 campaign spend
Efficiency lens
INR 42.93 per result

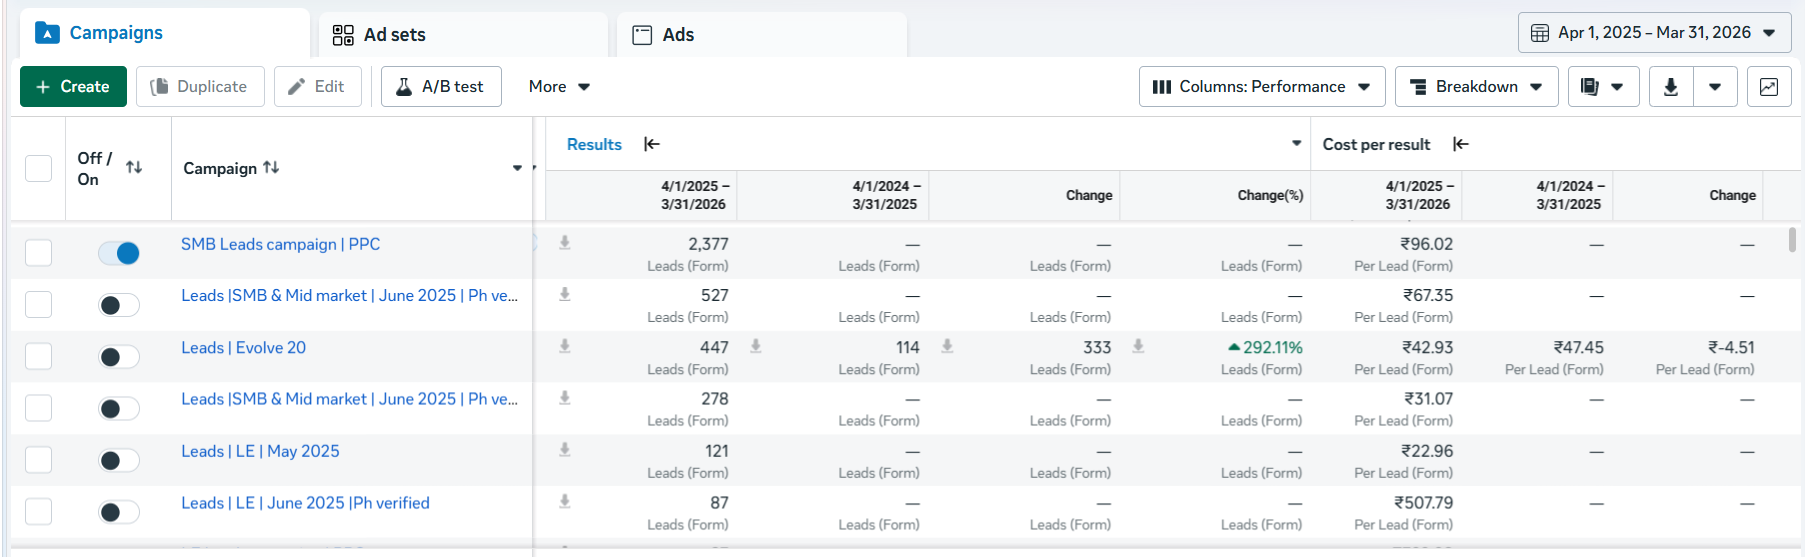
Apr 1, 2025–Mar 31, 2026. The Evolve 20 campaign recorded 447 Meta lead-form results versus 114 in the compared year (+292.11%); displayed cost per result fell 9.53%, from INR 47.45 to INR 42.93. These are not CRM-qualified leads.

Actual Meta Ads dashboard

Apr 1, 2025–Mar 31, 2026

Meta Ads Manager comparison for April 2025 to March 2026 showing B2B lead-form campaigns and cost per lead
Apr 1, 2025–Mar 31, 2026. The Evolve 20 campaign recorded 447 Meta lead-form results versus 114 in the compared year (+292.11%); displayed cost per result fell 9.53%, from INR 47.45 to INR 42.93. These are not CRM-qualified leads.

The next constraint

Volume was visible. Qualification was not.

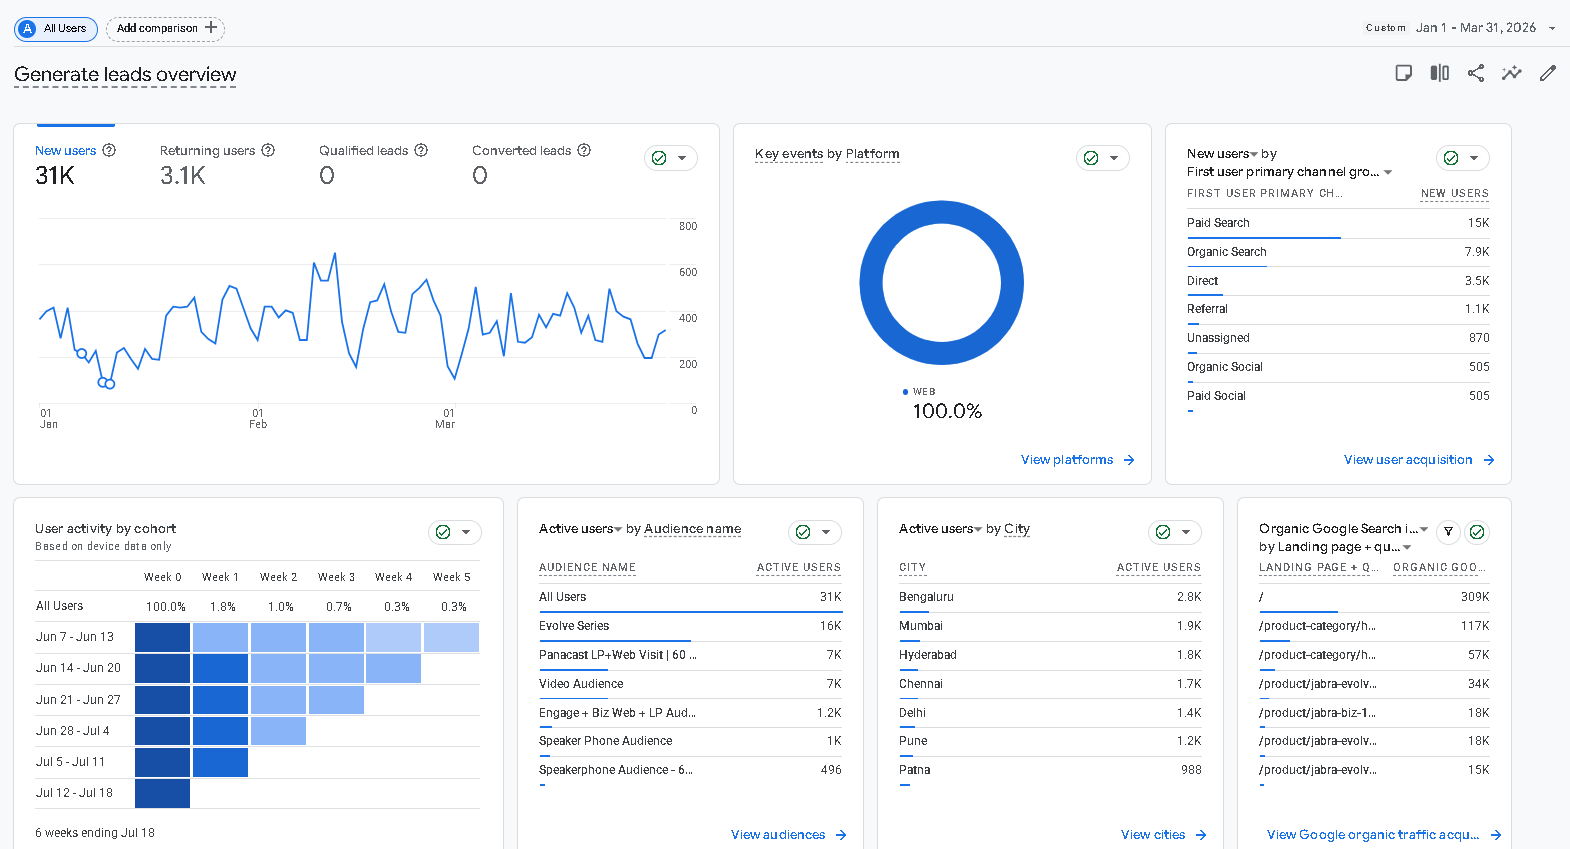
GA4’s Generate Leads report showed zero qualified leads and zero converted leads. That does not mean the sales team received no qualified opportunities. It means the supplied measurement layer stopped before sales outcomes returned to media.

Actual GA4 dashboard

The downstream stages stayed empty

Q1 2026

Full GA4 Generate Leads overview for Q1 2026 showing new and returning users with zero qualified leads and zero converted leads, with the client name redacted
GA4’s zero values describe the supplied analytics configuration. They do not prove that the business had zero qualified leads or sales. The lower cohort card shows June–July labels despite the Jan–Mar report range, so we rely only on the top lead-stage fields. We retain the full dashboard and redact the client name in four landing-page paths.

“Every recommendation is backed by clear insights, data, and an understanding of our B2B business goals.”

National business manager Global enterprise collaboration technology company

Your next constraint

Do your platforms report leads while sales still questions quality?

We will audit the campaign structure, measurement, funnel, and CRM feedback together. You will leave knowing which number deserves budget—and which number only looks good in a dashboard.

Audit My B2B Demand System
Book Strategy Call