Ecommerce measurement and paid-growth case study

We fixed the signal. Then we built a 19× quarter.

The customer came to us while Google Ads was spending without a dependable revenue signal. March captured effectively no value. April reported 0.17×. We repaired measurement, rebuilt the account, and reached 10.86× in May, 14.59× in June, and a 19.00× quarterly peak—then used the Q2 regression to find the next growth constraint.

  • Conversion measurement
  • Google Ads strategy
  • GA4 diagnosis
  • Shopify validation
The customer arrived Signal missing

Spend continued while value capture failed

We repaired Measurement

May 8–9 marked the new reporting regime

We scaled 19.00×

Quarterly platform ROAS peaked in Q1

We diagnosed 15.78×

Q2 exposed the next allocation problem

The signal

First, we fixed what Google could see.

March spent INR 227.8K while Google Ads captured effectively no conversion value. April spent INR 273.2K and reported only 0.17×, while GA4 attributed INR 3.54M to google / cpc and Shopify’s structured export recorded INR 6.83M in total sales. Those platforms should not match, but that mismatch and 22 zero-value Ads days proved the account could not give bidding a dependable commercial signal.

March spend INR 227.8K

Effectively no captured value

April reported ROAS 0.17×

22 of 30 days recorded zero value

May reported ROAS 10.86×

Value signal stabilized on May 8–9

June reported ROAS 14.59×

Double-digit efficiency held

Google Ads

Reported ROAS changed when measurement changed

Calendar months · value / cost

The jump is too large to present as creative performance alone. The underlying value signal entered a new measurement regime.
Open the accessible monthly data table
Google Ads reported monthly recovery
Month Spend Platform ROAS Evidence note
Mar ’25 INR 227.8K ≈0× Effectively no captured value
Apr ’25 INR 273.2K 0.17× Incomplete value signal
May ’25 INR 307.3K 10.86× Measurement stabilized
Jun ’25 INR 303.3K 14.59× Double-digit result sustained
Actual Google Ads dashboard

Q2 2025 crossed the repair boundary

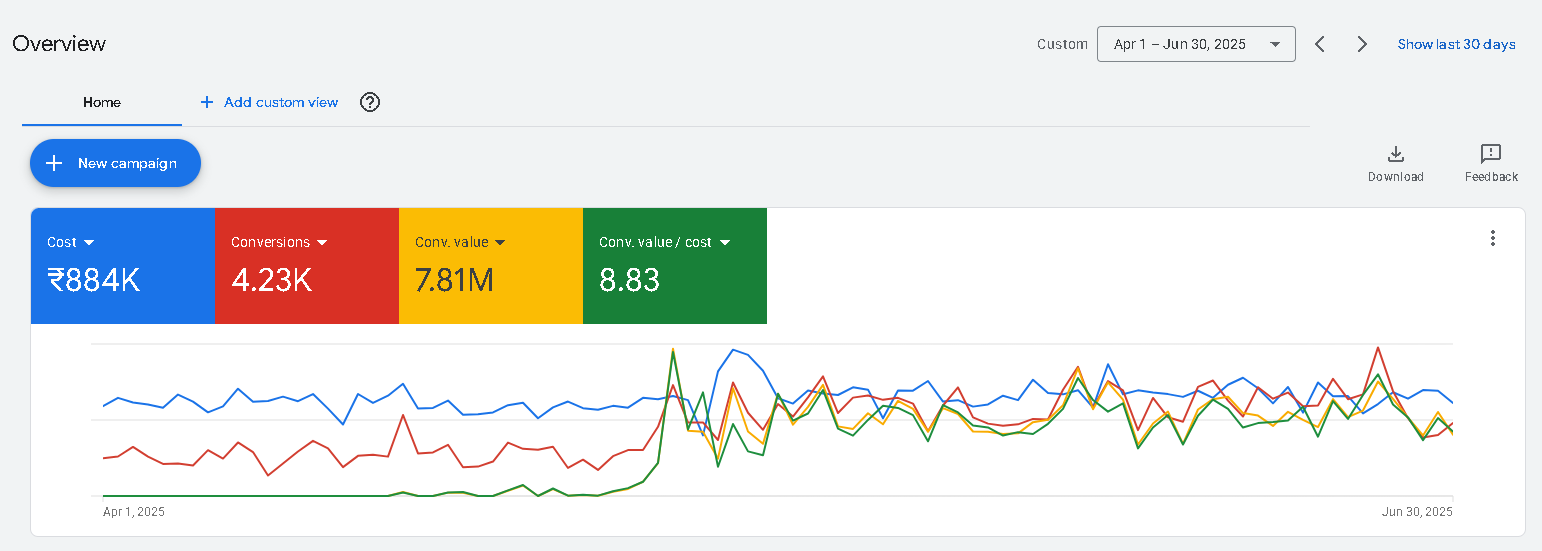
Apr 1–Jun 30, 2025

Google Ads Q2 2025 dashboard showing INR 884K cost, INR 7.81M conversion value, and 8.83 conversion value per cost
The 8.83× quarter contains both the impaired April signal and the stabilized May–June period. We do not use it as a clean pre/post baseline.

The rebuild

We turned cleaner data into a new account structure.

We did not stop after the tag started returning value. We used the new signal to split demand, rebuild campaigns, change bids and budgets, refresh assets, and scale the product and audience combinations that kept earning spend.

  1. 01

    Audit the signal

    We separated purchase value from add-to-cart, checkout, zero-value, and duplicate purchase actions before trusting the headline.

  2. 02

    Repair measurement

    We restored a value signal that could guide decisions, then kept Google Ads, GA4, and Shopify in separate reporting scopes.

  3. 03

    Rebuild demand

    We reorganized Brand, Shopping, high-intent Search, and focused Performance Max around the campaigns and products that earned scale.

  4. 04

    Control the tests

    We changed budgets, bidding, assets, keywords, audiences, goals, and campaign states as new evidence arrived.

Before the break 0.32×

Apr 1–May 7 · INR 335.8K spend

Transition May 8

6.12× reported on the changeover day

After the break 14.19×

May 9–Jun 30 · INR 538.5K spend

Average daily spend rose 12.0% across the boundary while captured value per day rose 4,848.7%. That discontinuity confirms a measurement-regime change. It does not support a claim that actual business return increased 44.2× overnight.

Actual Google Ads dashboard

The rebuilt system held 15.10× in Q3

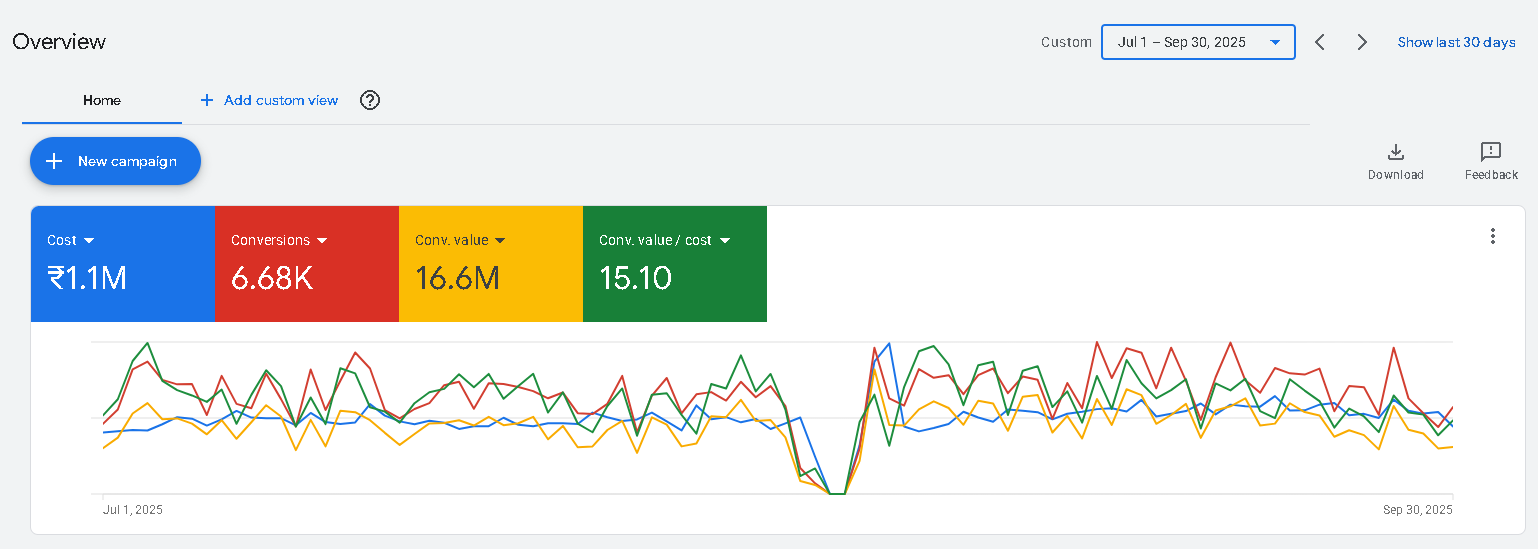
Jul 1–Sep 30, 2025

Google Ads Q3 2025 dashboard showing INR 1.1M cost, INR 16.6M conversion value, and 15.10 conversion value per cost
Spend expanded beyond Q2 while platform ROAS rose to 15.10×. We still checked the same period in GA4 and Shopify before interpreting the business outcome.

The interruption

Then the signal went quiet again.

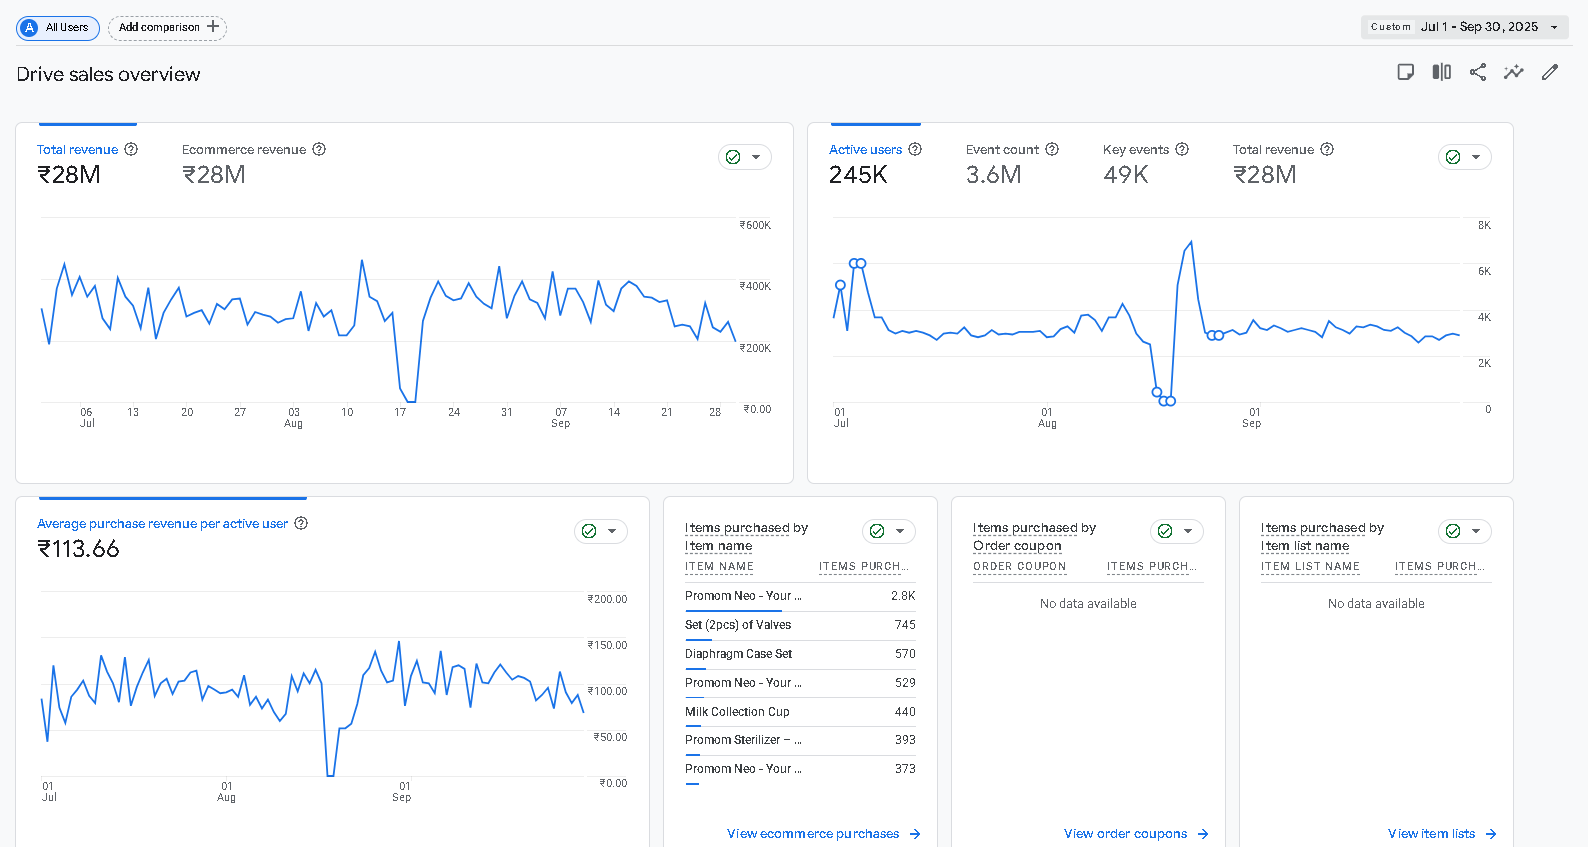
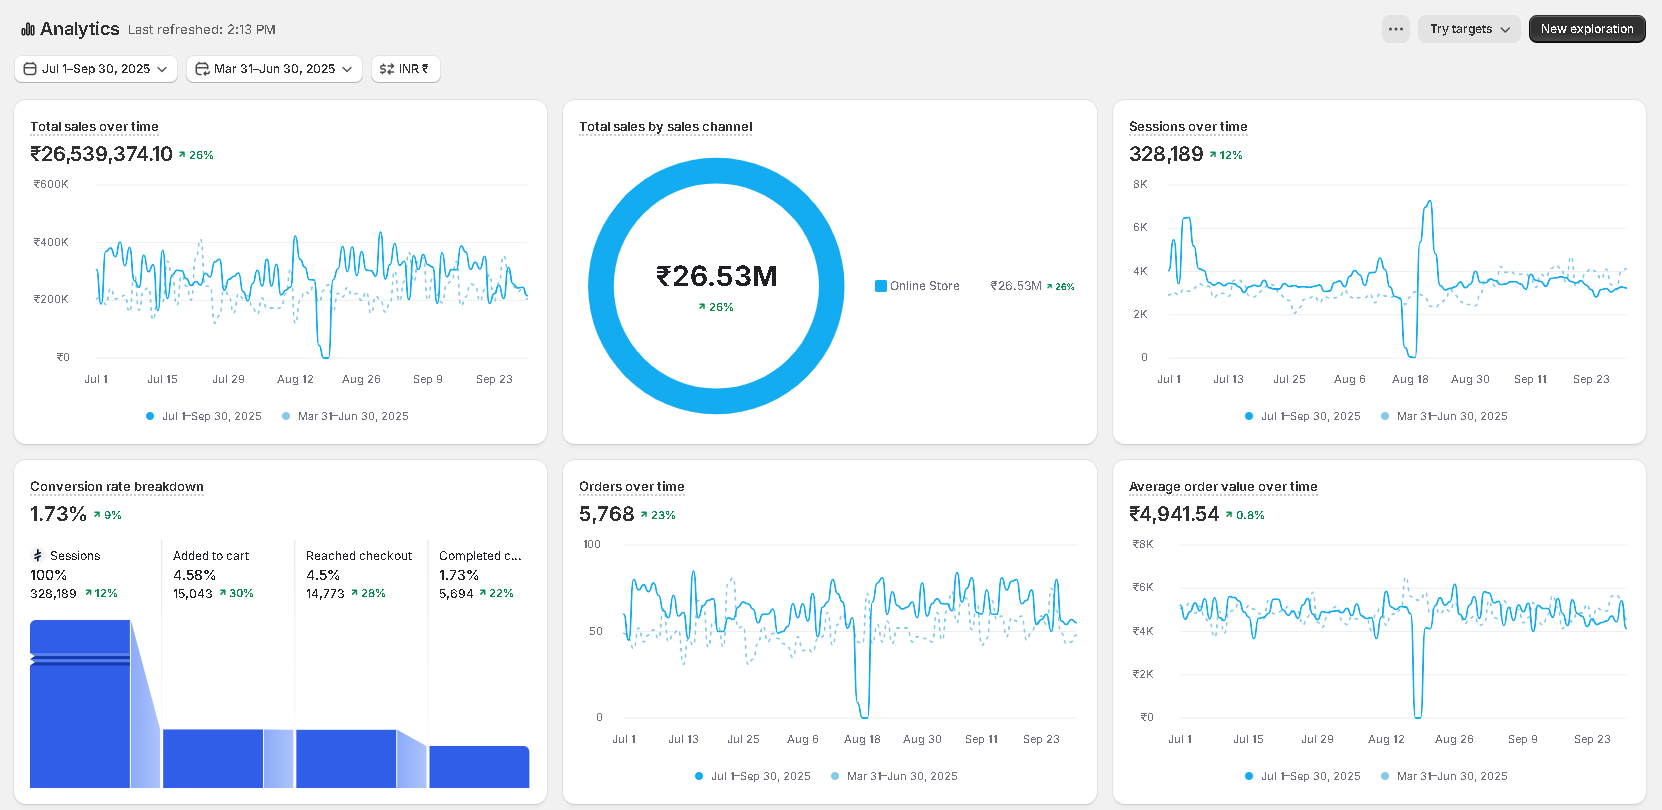
GA4 and Shopify both show a sharp August 17–19 break. GA4 recorded a 93.7% three-day session collapse and no revenue or transactions on August 18–19. Shopify’s quarter-level daily record also omits August 18–19. We did not label the dip a campaign failure. We isolated a cross-system interruption and kept the cause open: measurement, traffic, site, or checkout.

Actual GA4 dashboard

The August reporting break

Q3 2025

GA4 Q3 2025 drive sales overview showing the August revenue and active-user interruption
We crop the dashboard before the product-name area. GA4 alone cannot prove why the interruption occurred.
Actual Shopify dashboard

The store view shows the same break

Q3 2025

Shopify Q3 2025 analytics dashboard showing INR 26.53M total sales and the August store-activity interruption
Shopify provides the all-channel store view. The screenshot supports the timing, not a paid-media causality claim.

The scale

Quarterly ROAS climbed to 19.00×.

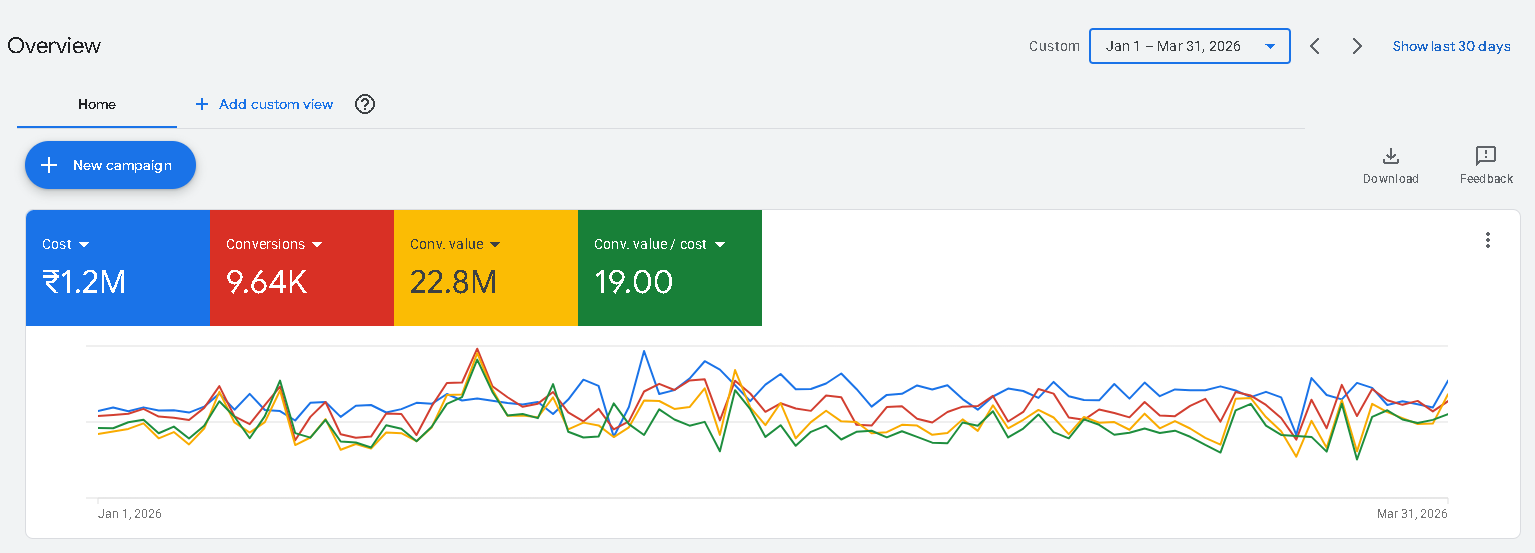
After Q3 stabilized at 15.10×, the account reached 16.78× in Q4 and 19.00× in Q1 2026. From Q2 2025 to the Q1 peak, spend rose 35.7% while platform-attributed value rose 191.9%.

Google Ads

The complete quarterly record

Weighted conversion value / cost

We show the regression beside the peak because the story is an operating system—not a cherry-picked quarter.
Open the accessible quarterly ROAS table
Google Ads platform ROAS by quarter
Quarter Spend Platform value ROAS
Q2 2025INR 883.8KINR 7.81M8.83×
Q3 2025INR 1.10MINR 16.59M15.10×
Q4 2025INR 1.08MINR 18.16M16.78×
Q1 2026INR 1.20MINR 22.79M19.00×
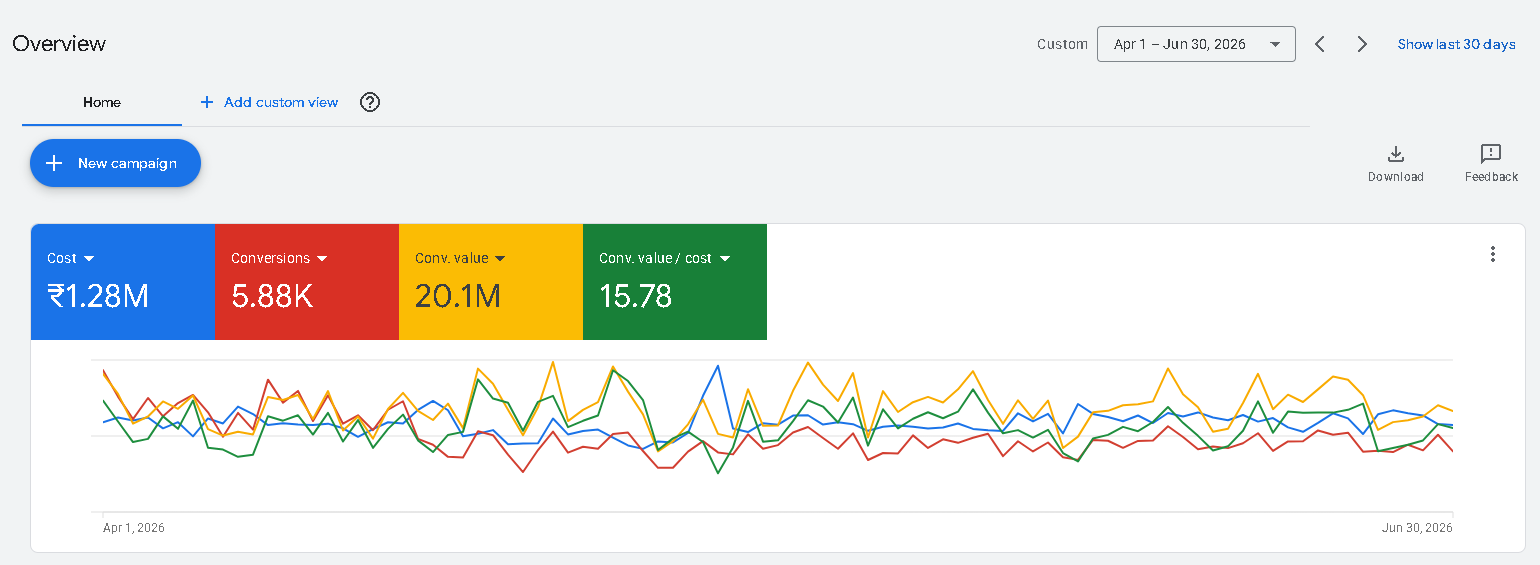
Q2 2026INR 1.28MINR 20.12M15.78×
Actual Google Ads dashboard

Q1 peak · 19.00×

INR 1.20M spend

Google Ads Q1 2026 dashboard showing INR 1.2M cost, INR 22.8M conversion value, and 19.00 conversion value per cost
Q1 2026 is the verified quarterly platform peak.
Actual Google Ads dashboard

Q2 regression · 15.78×

INR 1.28M spend

Google Ads Q2 2026 dashboard showing INR 1.28M cost, INR 20.1M conversion value, and 15.78 conversion value per cost
Q2 remained 78.6% above Q2 2025 ROAS, but it fell 17.0% from the Q1 peak.

The next constraint

We diagnosed the fall instead of defending the headline.

Q2 spend rose 6.3% while platform value fell 11.7%. New Search and Demand Gen tests spent INR 130.6K at 3.96×; the continuing core returned 17.13×. The core also softened from the Q1 peak, so pausing tests alone could not explain the whole regression. We widened the diagnosis to GA4 and Shopify.

New Q2 tests 3.96×

INR 130.6K spend · INR 517.0K platform value

Continuing core 17.13×

INR 1.145M spend · INR 19.61M platform value

Quarterly movement −17.0%

19.00× in Q1 → 15.78× in Q2

Three dashboards, three jobs

We stopped asking one number to explain the whole business.

Google Ads

Allocation signal

Which campaigns deserve spend?

Platform-attributed value, cost, and weighted ROAS.

GA4

Measurement signal

What happened to traffic and measured revenue?

Sessions, revenue, distinct transaction IDs, and reporting breaks.

Shopify

Store signal

Did the all-channel store outcome hold?

Sales, orders, weighted order value, and returns.
GA4 diagnosis

Traffic expanded faster than measured revenue.

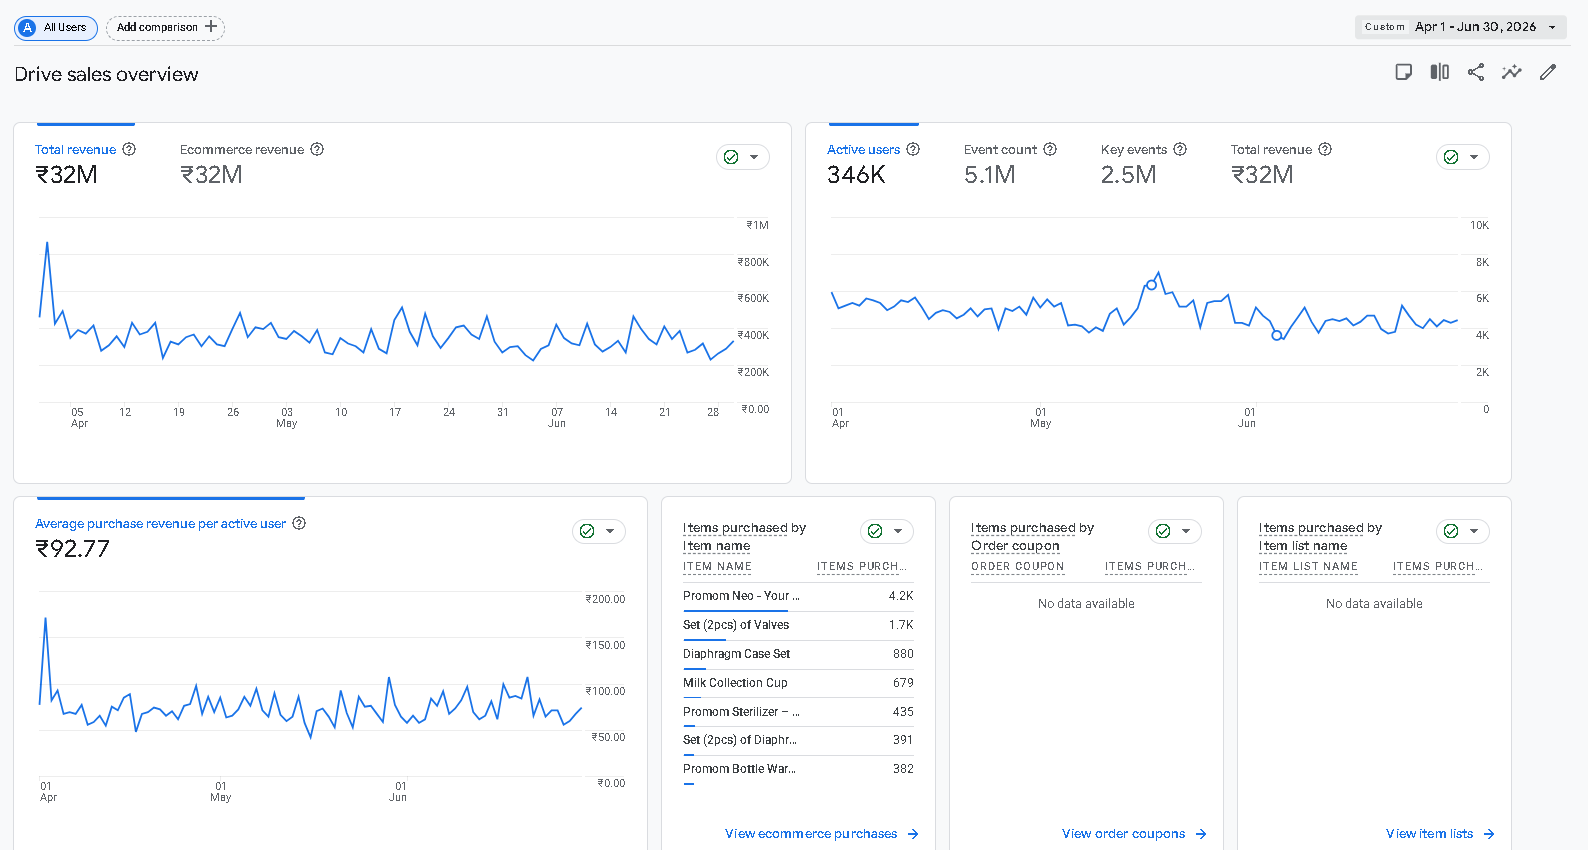
From Q2 2025 to Q2 2026, GA4 recorded 68.0% more sessions, 42.9% more revenue, and 54.7% more distinct transaction IDs. Yet revenue per session fell 15.0%. From Q1 to Q2 2026, sessions rose 20.8% while GA4 revenue fell 9.7% and revenue per session fell 25.3%. The account had reach; it needed stronger monetization.

Actual GA4 dashboard

Measured reach, revenue, and the efficiency gap

Q2 2026

GA4 Q2 2026 drive sales overview showing approximately INR 32M revenue and 346K active users
We crop the screenshot before product names. GA4-reported revenue remains separate from Google Ads value and Shopify sales.
Accessible GA4 table

Q2 year-over-year measurement record

GA4 Q2 2025 versus Q2 2026
GA4 metric Q2 2025 Q2 2026 Change
Sessions 287,898 483,700 +68.0%
GA4-reported revenue INR 22.46M INR 32.09M +42.9%
Distinct transaction IDs 4,047 6,261 +54.7%
Returning-session share 22.58% 32.52% +9.93 pp
Revenue per session INR 78.02 INR 66.34 −15.0%
Shopify validation

The store grew year over year, then softened with the Q2 regression.

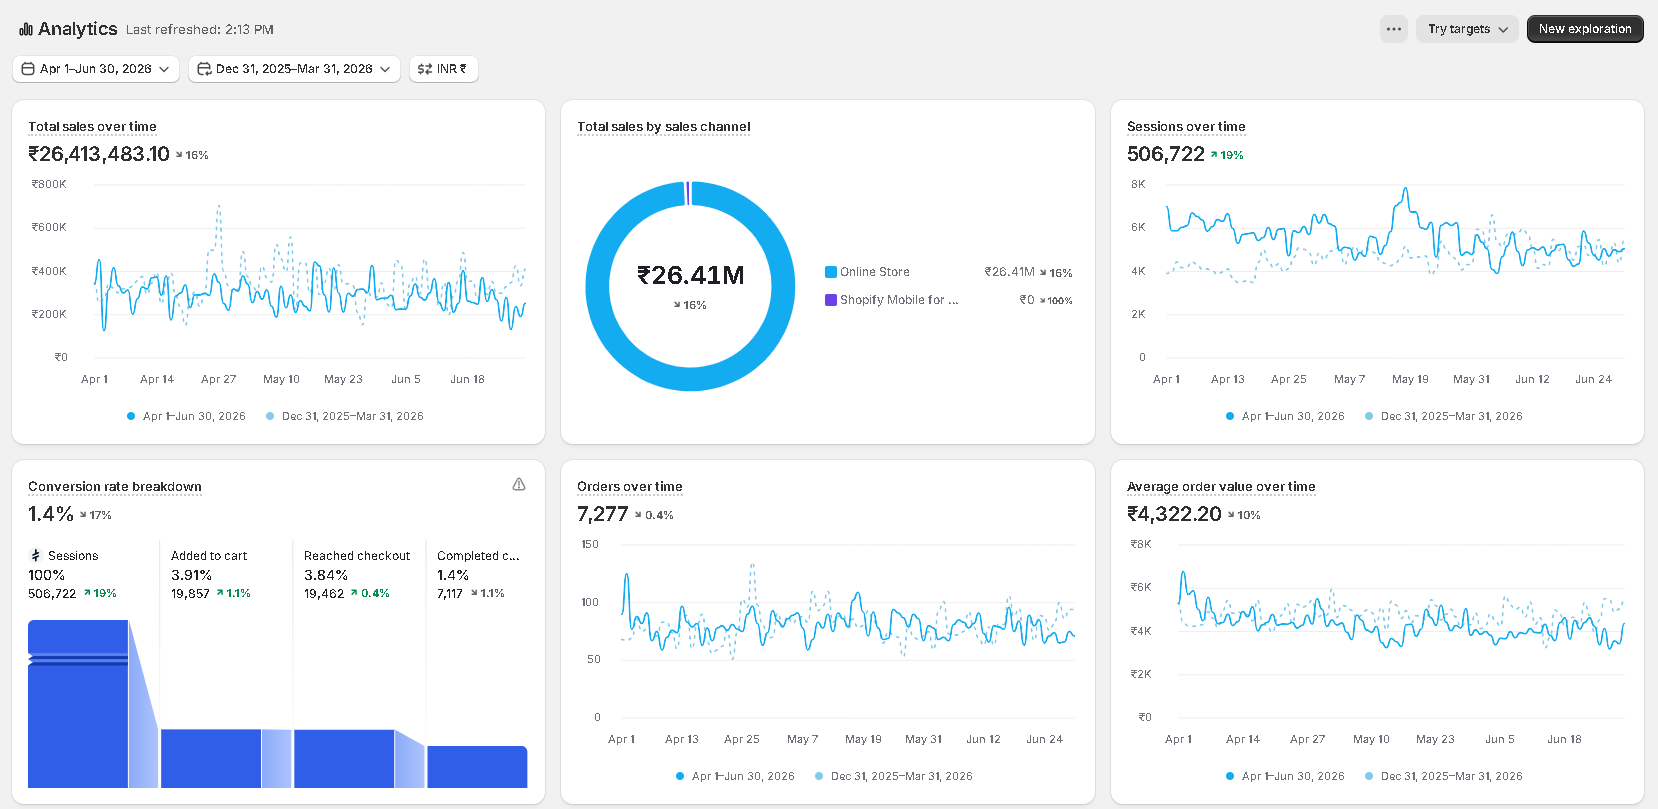
Quarter-aligned exports show Q2 total sales 22.3% above the prior-year quarter and 46.8% more orders. Weighted sales per order fell 16.7%, so volume carried more of the growth. Against Q1 2026, Q2 total sales fell 17.5% while orders fell only 3.4% and weighted sales per order fell 14.5%. That moved the next brief from reach to monetization quality.

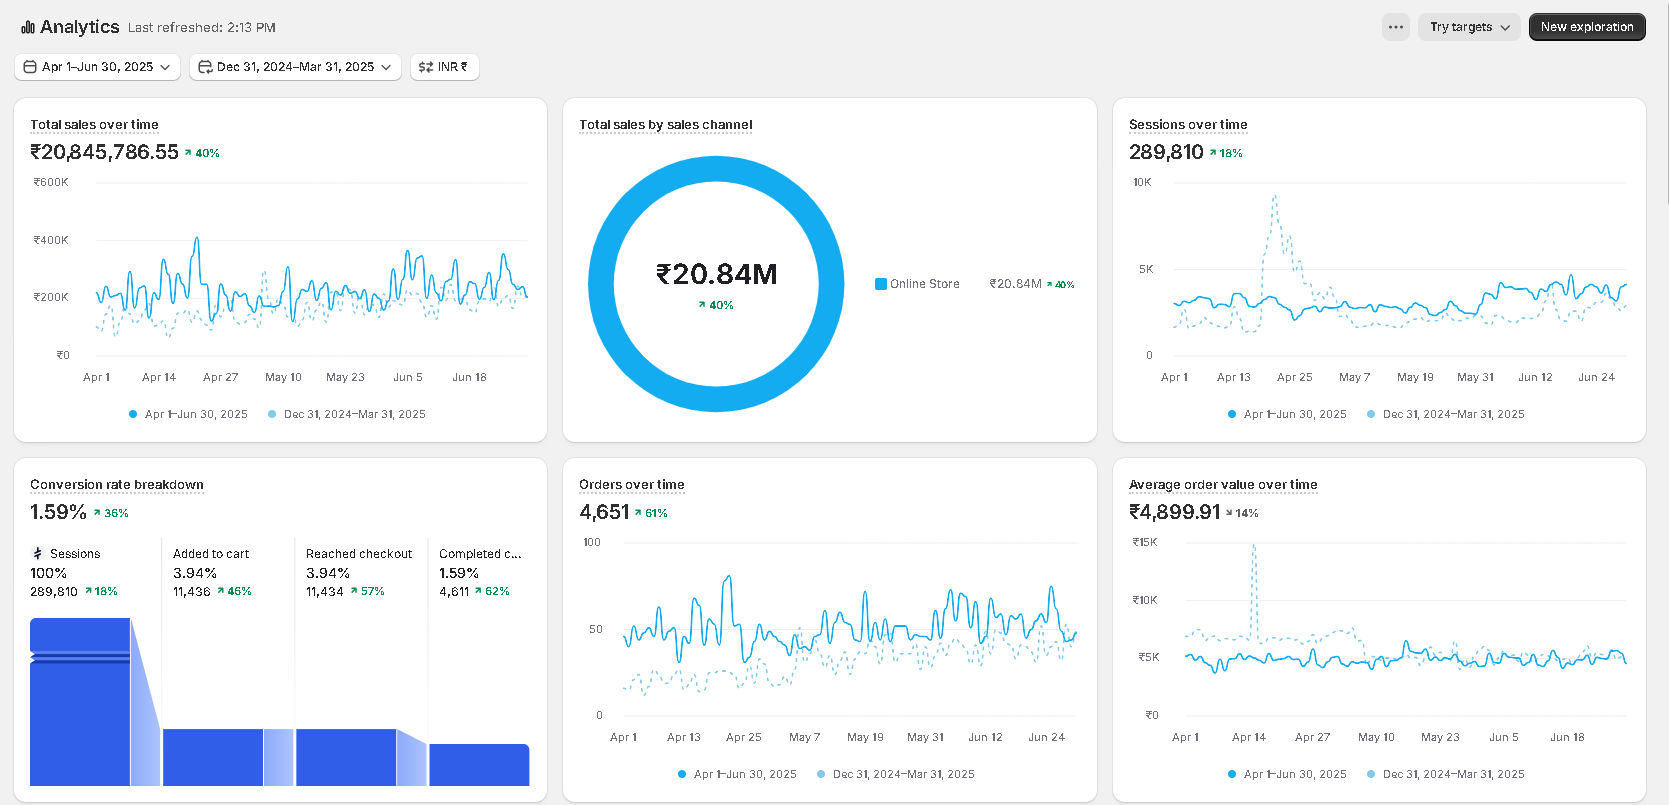
Actual Shopify dashboard

Q2 2025 store view

Baseline quarter

Shopify Q2 2025 analytics dashboard showing INR 20.84M total sales and 4,651 dashboard orders
Dashboard UI snapshot; export-derived comparisons appear in the table.
Actual Shopify dashboard

Q2 2026 store view

Latest quarter

Shopify Q2 2026 analytics dashboard showing INR 26.41M total sales and 7,277 dashboard orders
We expose no customer, order, or product detail in this dashboard snapshot.
Accessible Shopify table

Quarter-aligned export record

Shopify Q2 2025 versus Q2 2026
Store metric Q2 2025 Q2 2026 Change
Total sales INR 20.98M INR 25.65M +22.3%
Net sales INR 20.66M INR 25.05M +21.2%
Orders 4,435 6,510 +46.8%
Weighted sales per order INR 4,730 INR 3,941 −16.7%

The export record counts 4,435 and 6,510 orders in the two quarters. The dashboard widgets display 4,651 and 7,277. We preserve that definition boundary instead of silently forcing the figures to match.

Questions buyers ask

The numbers, without the shortcuts.

We want the story to earn confidence before it earns a call. These answers define what the evidence proves and how we would approach the same problem again.

Did we take actual business ROAS from 0.17× to 19.00×?

No. Both figures are Google Ads platform value divided by Google Ads cost, and the 0.17× period had incomplete value capture. We repaired measurement, then sustained and scaled the reported platform result. Shopify remains the separate store record.

Why does the case study begin with a tracking problem?

Because bidding cannot optimize toward revenue it cannot see. We first separated purchase value from duplicate, zero-value, and upper-funnel actions; then we used the cleaner signal to rebuild campaigns and allocate budget.

What changed after May 8–9?

The value signal became sustained across Brand, Performance Max, competitor, nonbrand Search, and Shopping. A new Search ad group began serving, and Shopping expanded. The evidence supports a measurement-regime break and account rebuild, not a one-day creative miracle.

Why do Google Ads, GA4, and Shopify show different revenue figures?

They use different attribution rules, event definitions, and scopes. We use Google Ads to steer paid-media allocation, GA4 to diagnose measured traffic and revenue, and Shopify to read all-channel store outcomes.

Why do we use distinct GA4 transaction IDs?

Repeated purchase events inflated GA4’s Transactions metric. We use distinct IDs as the safer analytics count, although they still do not replace validated backend orders.

Why show the Q2 2026 decline?

Because a high-performing account still needs diagnosis. New tests returned 3.96×, the core softened, GA4 monetization fell behind traffic, and Shopify order value weakened. Hiding that quarter would hide the work that matters next.

Did the August interruption come from the website?

The evidence shows a shared interruption in GA4 and Shopify, but it does not isolate the cause. We keep measurement, traffic, site availability, and checkout failure open until direct operational evidence resolves them.

Can we guarantee the same ROAS?

No. Market demand, economics, inventory, creative, offer, site experience, and measurement all affect performance. We can guarantee a disciplined diagnosis, clear reporting boundaries, and an evidence-led scaling process.

Google Ads + GA4 + Shopify

Turn missing signals into better growth decisions.

Bring us the dashboards that disagree. We will trace the measurement gaps, rebuild the acquisition system, and show you what must improve before the next budget increase.

Find My Next Constraint
Book Strategy Call