Paid Media
United States · Liquor ecommerce · Google Ads, GA4 and Shopify
We rebuilt paid growth to 7.20×—and the store started growing again.
The customer’s last complete month before our documented access returned 3.80× in Google Ads. We cleaned conversion tracking, rebuilt campaign roles, and kept working when the ad dashboard improved before the store did. By June, the complete account reached 7.20× platform ROAS. From Q1 to Q2, Shopify total sales rose 10.7%.
We start with the purchase signal, campaign economics, and store reality—not a larger budget.
- Last full month before access
- 3.80× November 2025 · platform ROAS
- Complete June account
- 7.20× Every campaign with spend
- Q2 Shopify total sales
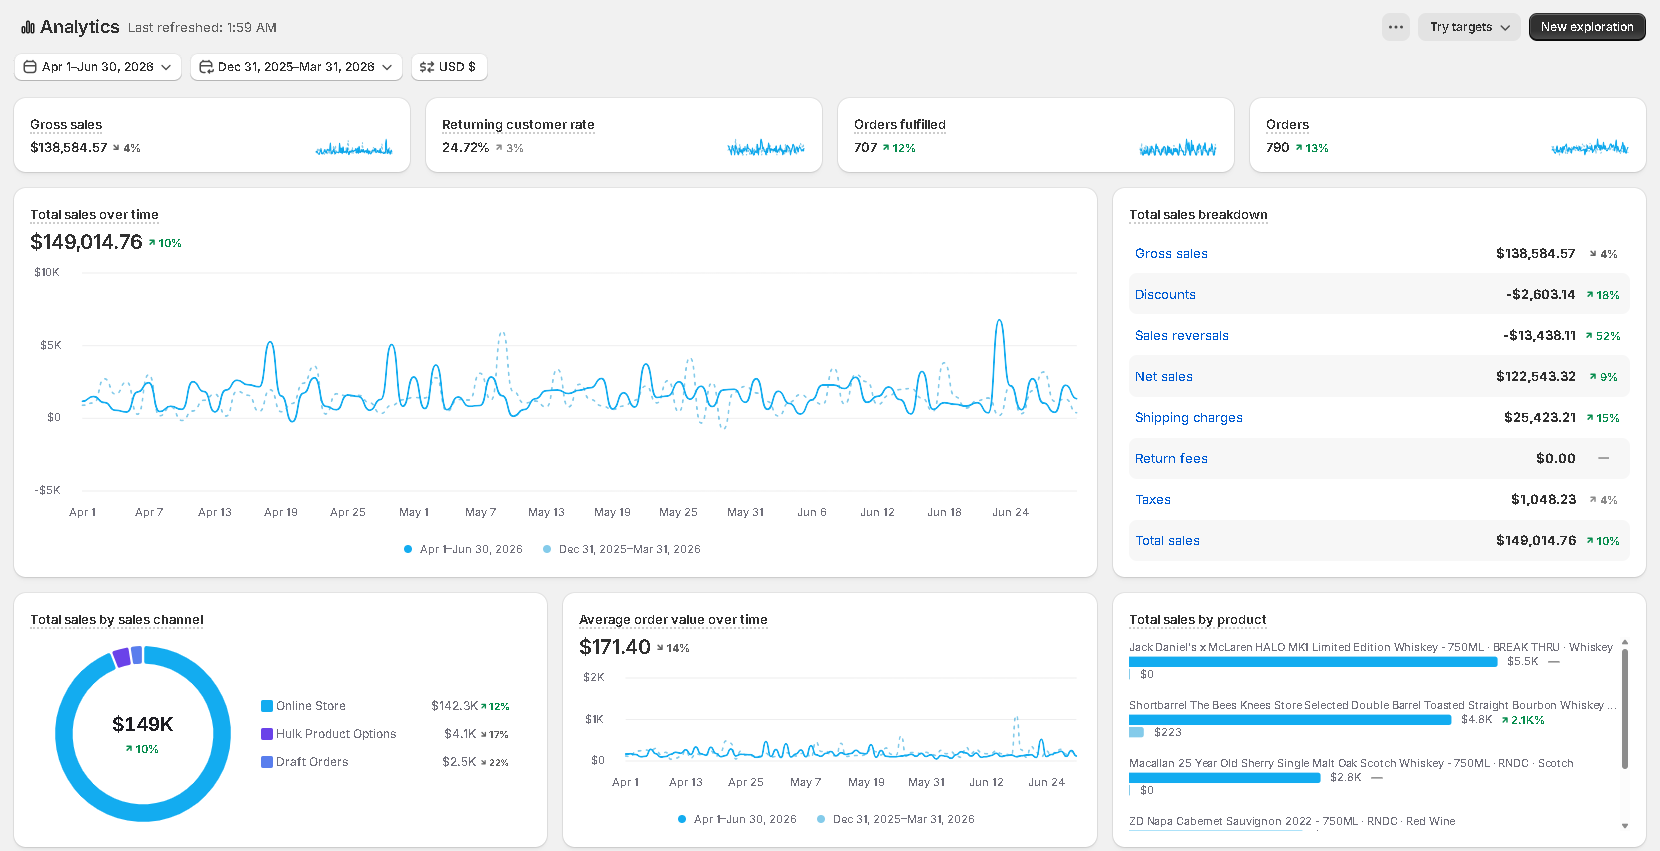
- $149,014.76 10.7% higher than Q1
- Q2 sales reversals
- 51.2% lower Q1 to Q2 · whole store
01 · The real problem
The ad account improved. The store still fell.
A better advertising number did not automatically mean a healthier ecommerce business. We had to make Google’s purchase signal trustworthy, then confirm that paid traffic and store sales moved in the same direction.
The last complete month returned too little certainty for aggressive scaling.
Legacy campaigns and several conversion actions made one blended number hard to trust.
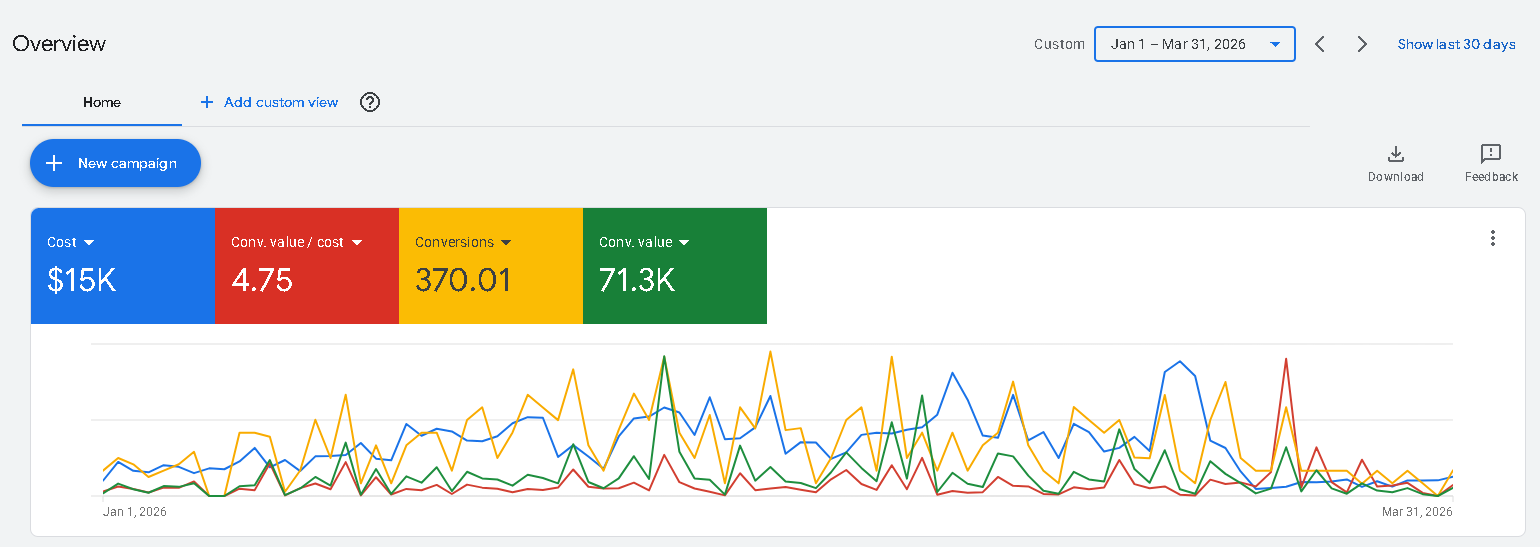
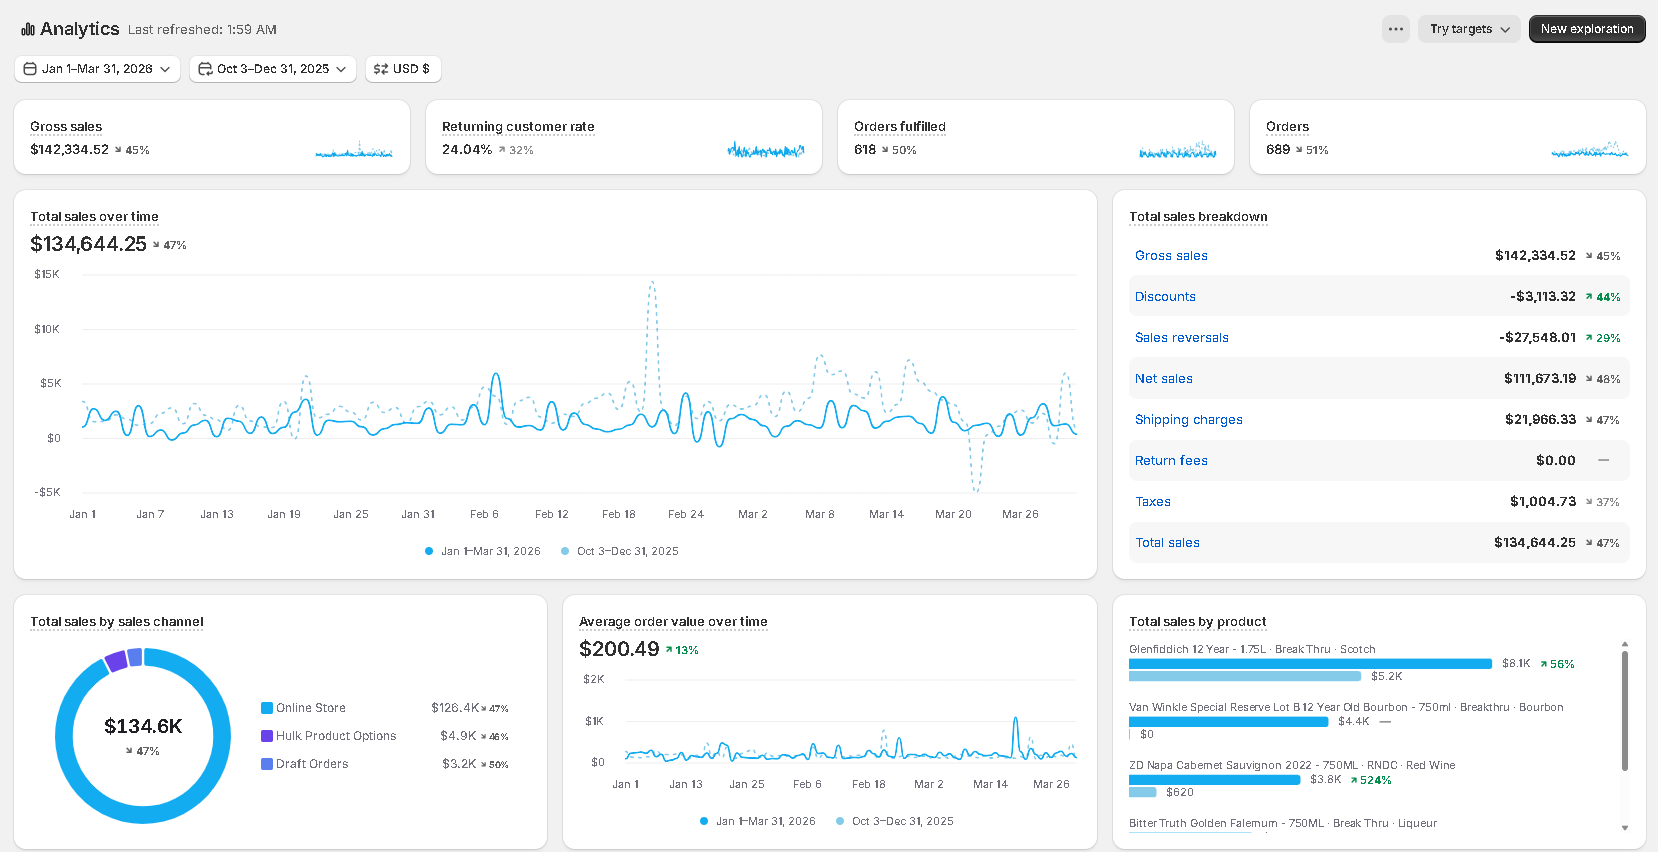
Q1 Google Ads improved, but Shopify showed a store-level warning.
Shopify reported $134,644.25 in Q1 total sales and displayed a 47% decline against the preceding equal-length holiday comparison.
We refused to call a stronger ad dashboard the finished result.
We checked GA4 paid-source purchases and Shopify store outcomes before deciding what deserved more budget.
02 · What we changed
We fixed what counted, what each campaign did, and what stopped earning spend.
We did not apply one blanket optimization. We rebuilt the decision chain from conversion action to campaign role to store-level validation.
- 01 Clean the signal
We removed five obsolete or duplicate conversion actions.
We stopped old purchase, checkout, and add-to-cart actions from competing with the purchase signal that should guide bidding.
Five actions removed within days of access - 02 Give every campaign one job
We rebuilt campaign roles and created a dedicated Shopping engine.
We separated product discovery, brand demand, high-intent search, and Shopping so each budget could prove what it earned.
New Shopping campaign: 6.13× through May 27 - 03 Stop funding weak tests
We isolated the spend that looked busy but returned too little.
Two May tests used 38.0% of spend but produced only 13.5% of attributed value. We paused both instead of scaling the blended account.
Weak May test pool: 1.22× platform ROAS
The structure gave us a useful failure signal. When a test returned too little, we could stop it without starving the campaign pool that had earned budget.
03 · What moved
June reached 7.20×. Shopify returned to quarter-over-quarter growth.
We kept every system in its proper lane. Google Ads told us which campaigns earned spend. GA4 showed paid-source purchase behavior. Shopify showed what happened across the whole store.
More attributed conversions without matching spend growth.
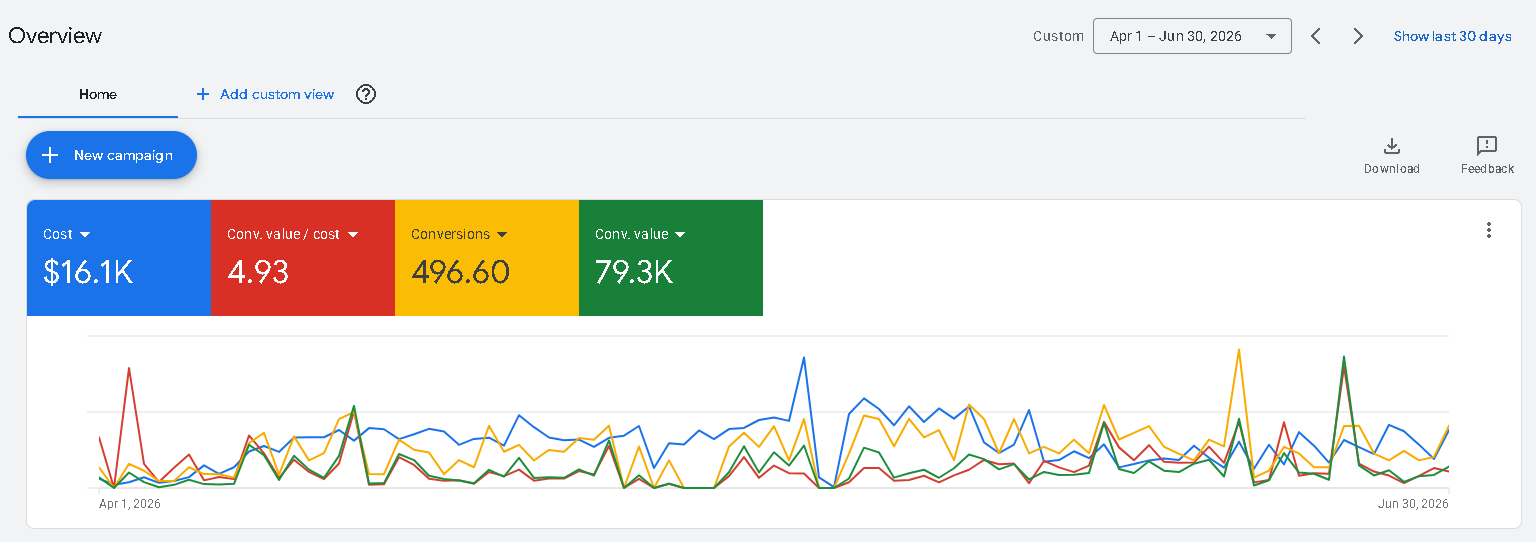
- Platform conversions
- 34.2% higher
- Attributed value
- 11.2% higher
- Ad spend
- 7.2% higher
- Quarter ROAS
- 4.75× → 4.93×
Paid-source transactions rose faster than paid-source revenue.
- Transactions
- 302 → 396
- Transaction change
- 31.1% higher
- Purchase revenue
- 2.4% higher
- Revenue per transaction
- 21.9% lower
More orders produced more sales with far fewer reversals.
- Total sales
- 10.7% higher
- Orders
- 689 → 790
- Sales reversals
- 51.2% lower
- Average order value
- 14.5% lower
The surviving active engine
The store returned to growth
Source archive Open the full quarterly dashboards behind the story +
The mixed entry quarter
The first complete post-entry quarter
The quarter that ended at 7.20×
The store-level warning
04 · What it means
We now knew what deserved the next dollar—and what needed work next.
The account no longer forced one blended number to answer every question. We could scale the active engine, protect store-level gains, and address the smaller-basket constraint separately.
Protect the three-campaign engine that remained active.
It produced almost all June attributed value and excluded the test that failed.
Keep the reduction in sales reversals visible.
Platform revenue matters less when the store gives too much of it back.
Raise average order value without sacrificing conversion volume.
The next tests should address bundles, product mix, offers, and onsite merchandising.
Questions a careful buyer should ask
What the numbers prove—and what they do not.
Why does the Google Ads screenshot show 7.56× while the headline says 7.20×?
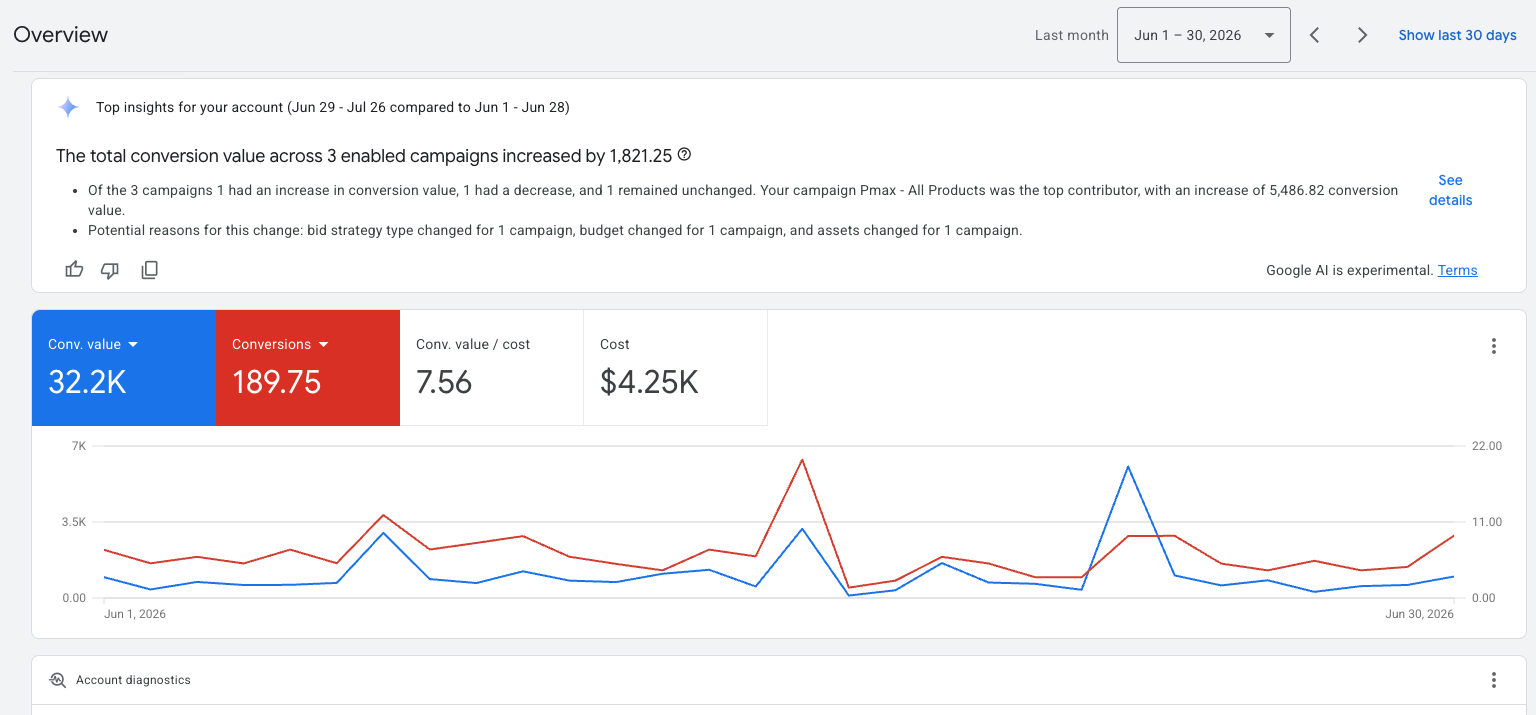
The screenshot shows the three campaigns that remain enabled: $32,176.38 in attributed value from $4,254.72 in spend. We report 7.20× for the complete June account because that also includes one high-intent test we later paused after it returned 0.60×.
Did the customer hand us an account at 3.80×?
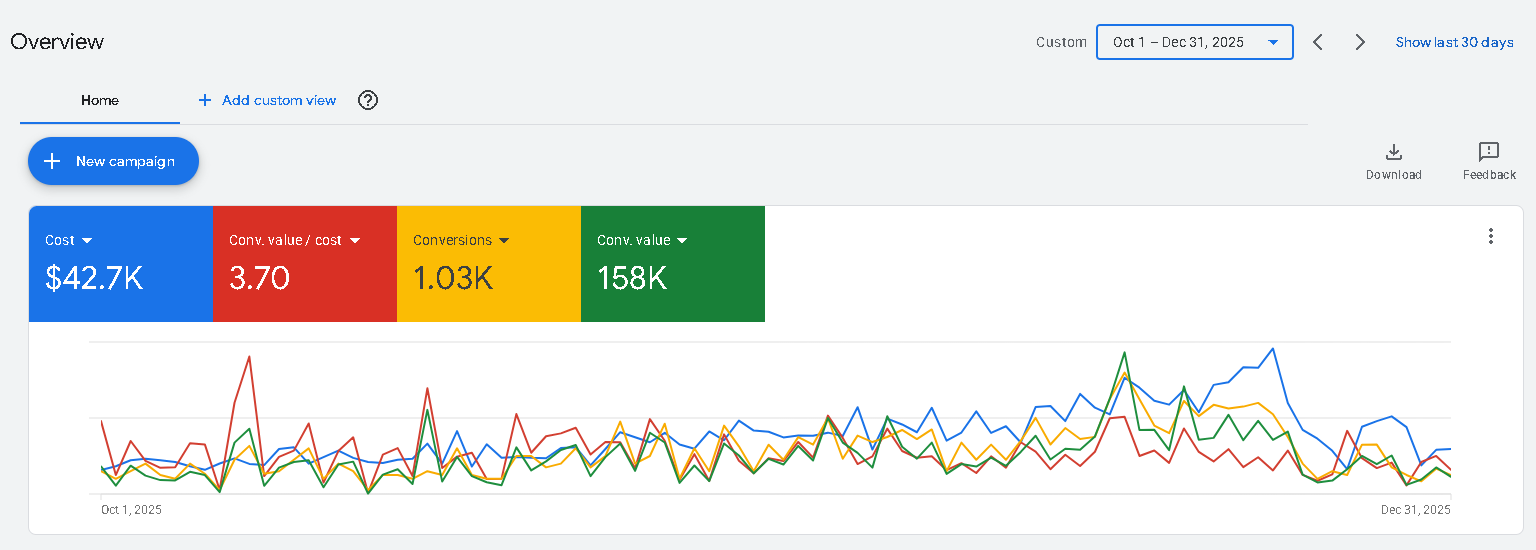
The last complete month before our documented access returned 3.80×. We first gained documented access on December 3, 2025, so we use November as the clean pre-access reference and keep December inside the entry period.
Did Google Ads alone cause Shopify sales to rise?
We do not make that claim. Google Ads reports platform attribution, GA4 reports paid-source website activity, and Shopify reports whole-store results across every channel. Their shared direction supports the story; it does not create a controlled incrementality experiment.
Can another ecommerce store expect the same result?
No result comes with a guarantee. The repeatable part is our decision system: clean the purchase signal, separate campaign roles, stop weak spend, and check platform results against analytics and store outcomes before scaling.
Evidence, calculation, and attribution notes
Google Ads platform ROAS equals platform-attributed conversion value divided by ad cost. We calculate the 7.20× headline across every campaign with June spend. The screenshot’s 7.56× covers only the three campaigns that remain enabled.
We recalculate Shopify’s Q1-to-Q2 changes from the exact values in both native dashboards. Shopify’s Q2 interface compares Apr 1–Jun 30 with Dec 31–Mar 31, so its rounded arrows differ slightly from our clean calendar-quarter comparison.
GA4 paid-source data uses the exact session source / medium google / cpc. Google Ads, GA4, and Shopify use different attribution rules, date boundaries, and revenue definitions. We do not force them to match or relabel whole-store sales as ad revenue.