Google Ads account restructure · B2C + B2B

We separated two Google Ads jobs before the next budget decision.

One Google Ads account mixed consumer and B2B advertising, so we separated both journeys. At the consumer peak, Google Ads recorded 2.53× as many completion events on 49.5% less spend; the B2B rebuild recorded 265 platform-attributed submit actions.

Start with the structure and the signal—not a larger media budget.

The business
Multi-market mobile content with a separate B2B AI call-centre offer
The risk
One account mixed two buying journeys and two definitions of success
The decision
Separate campaign structure, landing paths, and conversion actions before budget decisions
Evidence window
June 2024 to September 2025

01 · Why scaling was unsafe

One conversion view could not show which journey was working.

A consumer thank-you-page visit and a B2B enquiry form answer different questions. When one account treated them as one story, the largest result could not show which journey deserved budget.

Consumer job

Promote mobile-content services across several telecom markets.

Each country, carrier, and product journey needed a clear place in the account and a result definition that matched it.

B2B job

Turn relevant Google searches into enquiries from companies.

The AI call-centre offer needed focused search intent, customer-owned landing paths, and a dedicated submit action.

02 · The decision

We refused to optimize one blended result.

Our audit traced campaigns, spend-bearing keywords, conversion actions, landing paths, and GA4 from click to recorded outcome. It showed that one number was trying to answer two incompatible questions.

  1. 01

    Trace

    Map each campaign to the action Google counted

    We checked the campaign, keyword, conversion-action, final-URL, and GA4 evidence before changing the structure.
  2. 02

    Separate

    Give each advertising job its own definition of success

    Consumer completion events and business enquiry forms no longer had to tell the same story.
  3. 03

    Rebuild

    Create a focused B2B path on customer-owned pages

    Four campaigns became one; spend-bearing broad-match rows fell from 35 to zero; two owned landing paths and a dedicated submit action replaced the fragmented setup.
  4. 04

    Govern

    Keep platform activity separate from business proof

    We treated Google Ads events, GA4 behavior, CRM-qualified outcomes, and revenue as different evidence—not interchangeable labels.

That decision gave every number one job. The consumer side could be judged on recorded completion-event efficiency. The B2B side could be judged on its dedicated submit action. Neither had to pretend to be revenue.

03 · The evidence

The two paths produced two different kinds of proof.

We compare complete quarters for the consumer campaigns. We show the B2B rebuild separately because its conversion action changed. Combining the two would make the result look simpler—and less truthful—than it was.

Consumer campaigns

From the first full-scale quarter to the verified peak: 2.53× as many recorded completion events on 49.50% less spend.

Most events were recorded when a thank-you page loaded. They are not unique people or confirmed sales. Q1 2025 was a peak, not a permanent level.
Recorded completion events
73,887 → 186,906
Ad spend
49.50% lower
Platform cost per event
80.04% lower
Platform conversion rate
4.26% → 8.63%
  1. January 202524,527events · AED 0.59 each
  2. February 202572,496events · AED 0.29 each
  3. March 202589,884events · AED 0.30 each
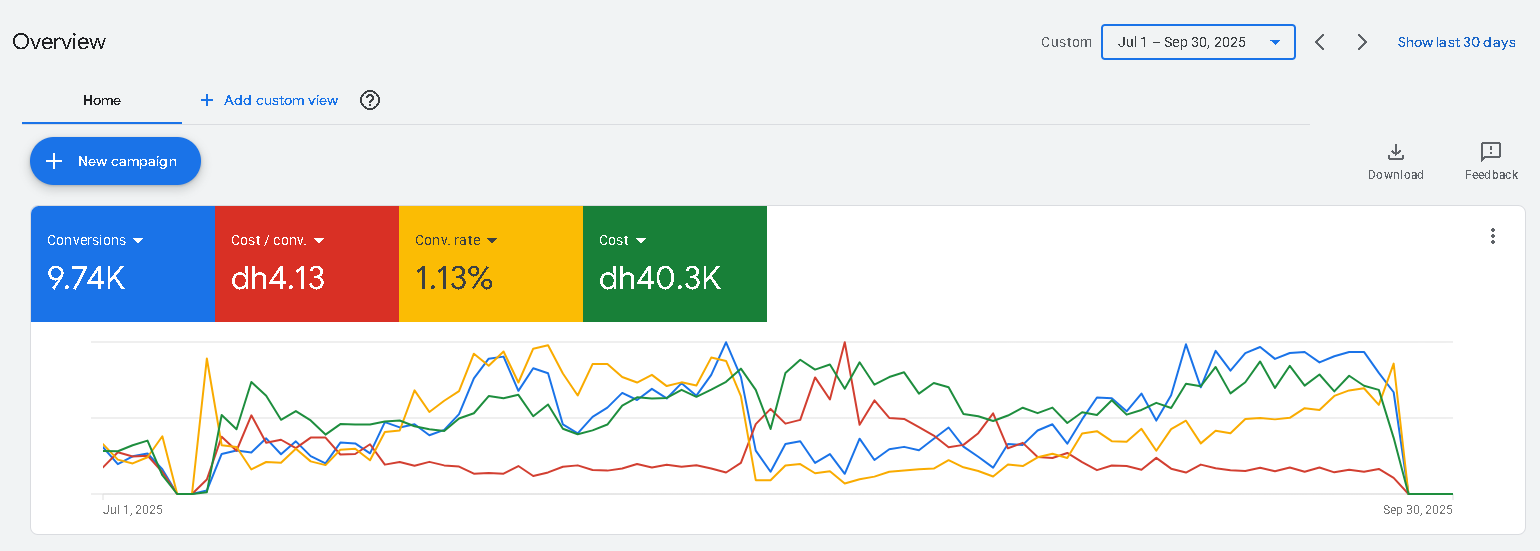
  4. After the peak9,741Q3 events · AED 4.13 each

The peak was concentrated and later declined. The supplied reports do not establish why, so we do not invent a cause or call the result sustained.

Actual Google Ads dashboard

First full-scale consumer quarter

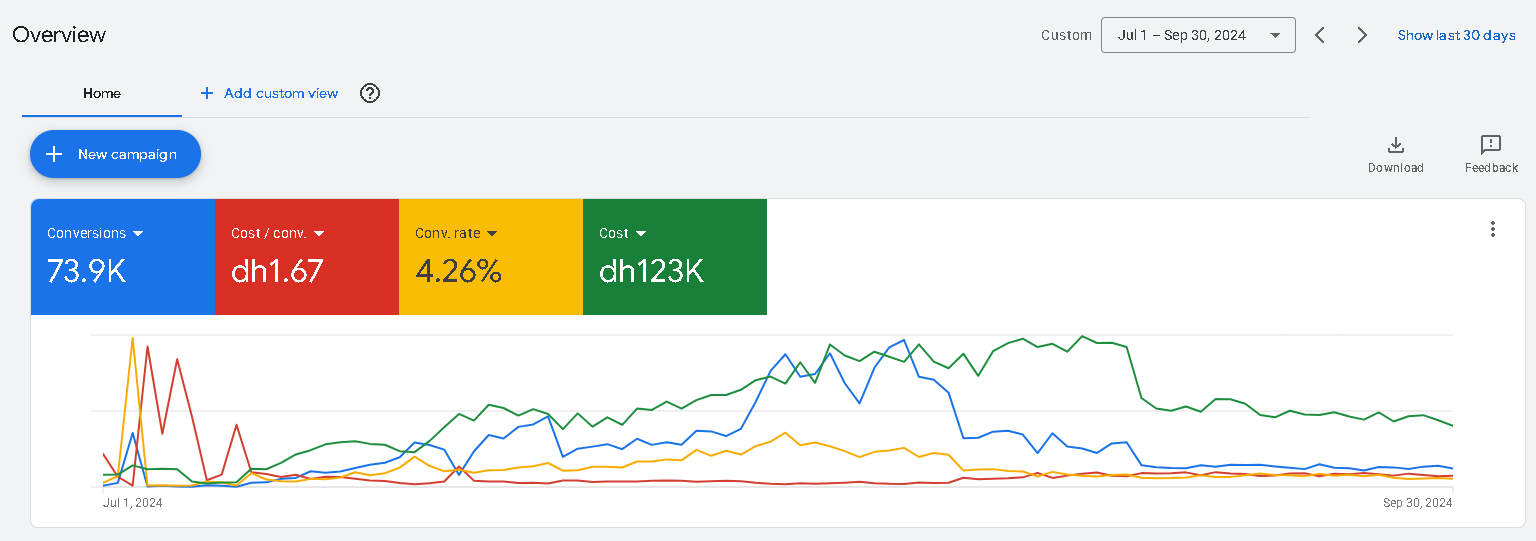
Full Google Ads overview for Q3 2024 showing 73.9 thousand conversion events at AED 1.67 each
Q3 2024 establishes the complete-quarter baseline: 73,887.40 recorded events at AED 1.67 each.
Actual Google Ads dashboard

Verified consumer peak

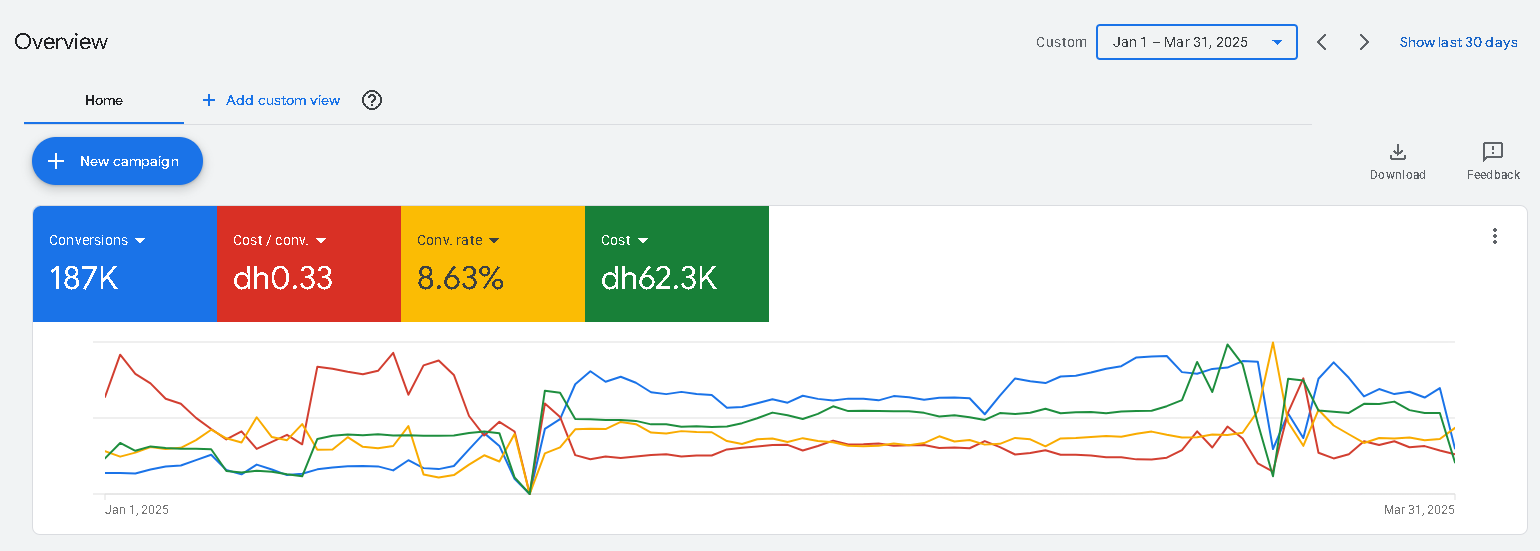
Full Google Ads overview for Q1 2025 showing 187 thousand conversion events at AED 0.33 each
Q1 2025 recorded 186,906.41 completion events at AED 0.33 each. It is the verified peak, not an ongoing-quarter claim.

Business enquiries

We turned a scattered search setup into one B2B path the account could measure.

The conversion definition changed, so we do not publish a like-for-like CPA improvement. The 265 actions were not independently confirmed as unique or CRM-qualified leads.
Before · Q1 2025 4 campaigns · 1 generic conversion 107 spend-bearing keyword rows, including 35 broad; six base URLs, including external form paths
After our rebuild · Q2 2025 1 campaign · 265 submit actions 0 broad, 3 phrase, 23 exact spend-bearing rows · two owned paths · AED 6.58 platform CPA
Actual Google Ads dashboard

Account context during the B2B rebuild

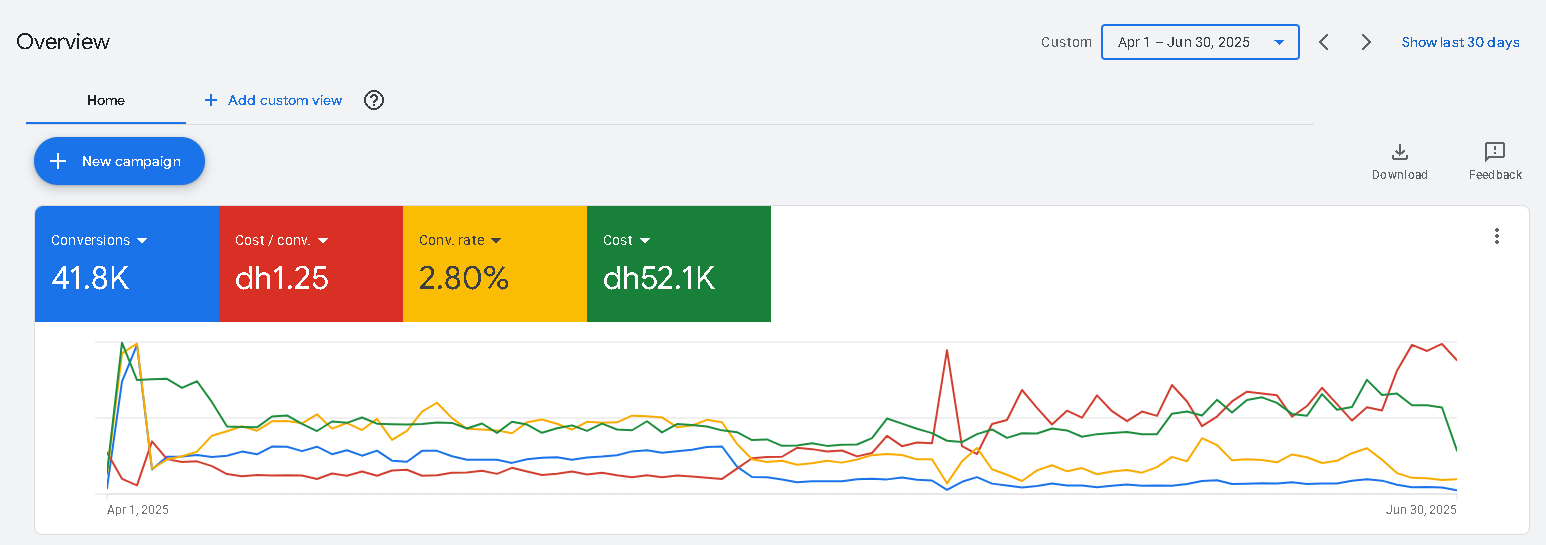
Full account-wide Google Ads overview for Q2 2025
This is the account-wide Q2 overview. The separate 265-action B2B result comes from the filtered campaign, conversion-action, keyword, and landing-page exports—not from the account-wide tiles shown here.

Analytics context

GA4 did not validate sales or revenue. That changed the claim—not the evidence.

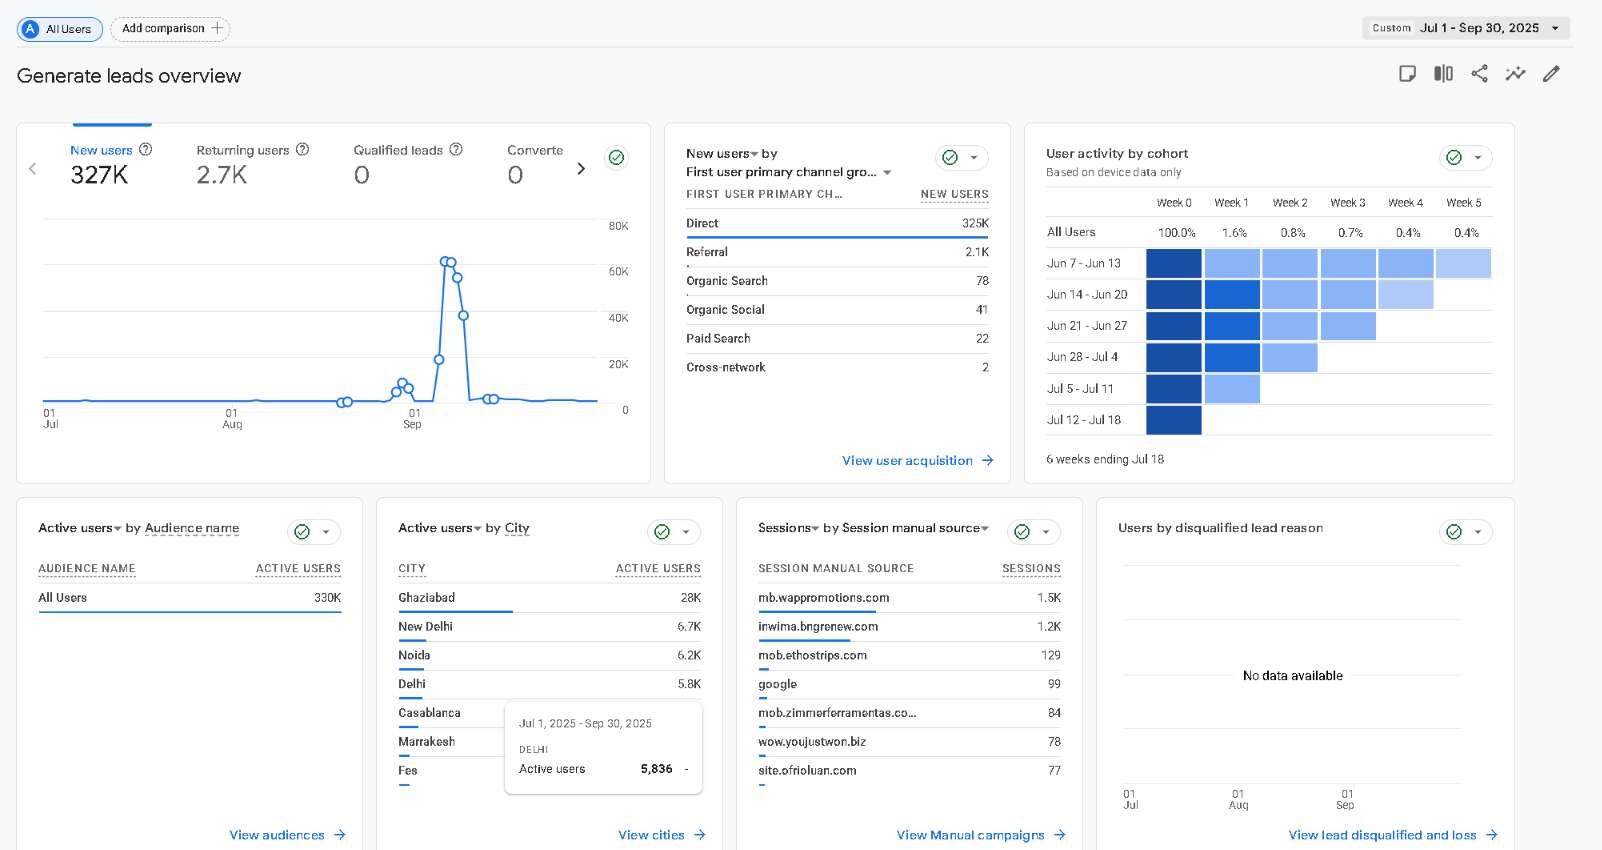
In Q3, GA4 attributed 325,043 new users to Direct while key events and revenue were both zero. We therefore report the Google Ads results as platform evidence, not as revenue, ROAS, or ROI.
Conversion value in Google Ads
0
Key events in GA4
0
Revenue in GA4
0
New users attributed to Direct
325,043
Actual GA4 dashboard

The measurement gap that limited the claim

Locally obscured full GA4 Generate leads overview for Q3 2025
Q3 2025 · source names obscured for local review. We did not use this unexplained traffic as sales or revenue proof.
View the full performance dashboards
Google Ads · launch quarter

Q2 2024

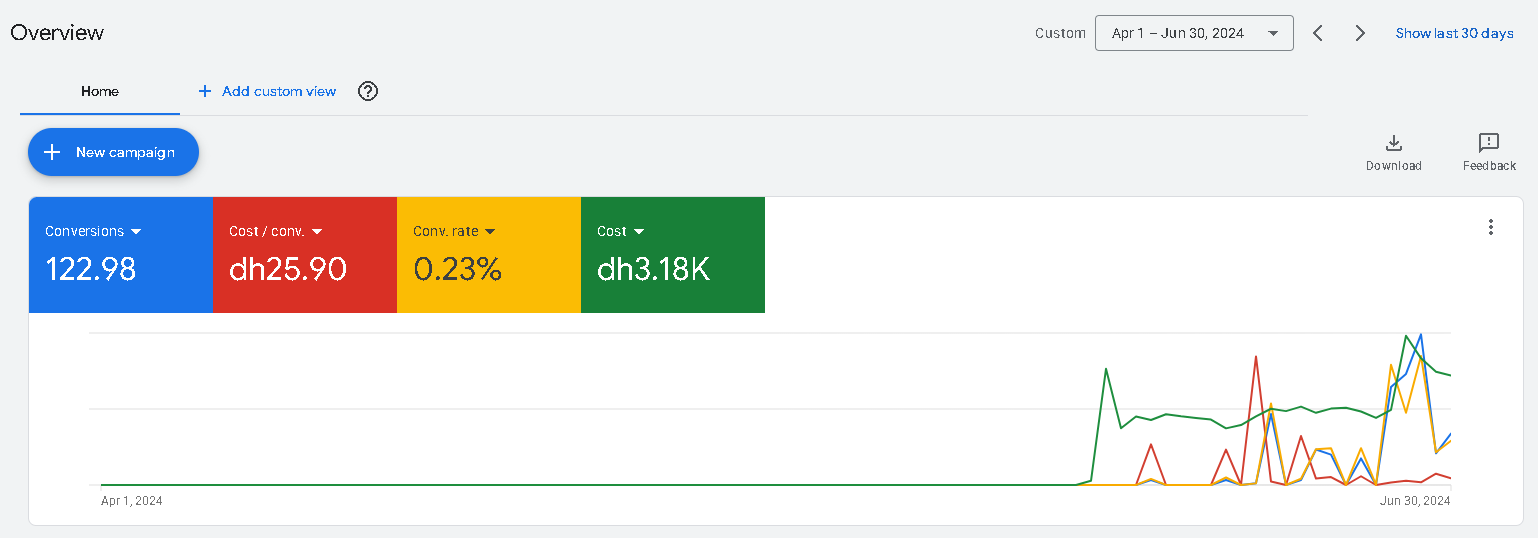
Full Google Ads overview for Q2 2024 showing 122.98 conversion events at AED 25.90 each
Campaign spend began in June; this is a launch period, not a mature-quarter baseline.
Google Ads · efficiency step

Q4 2024

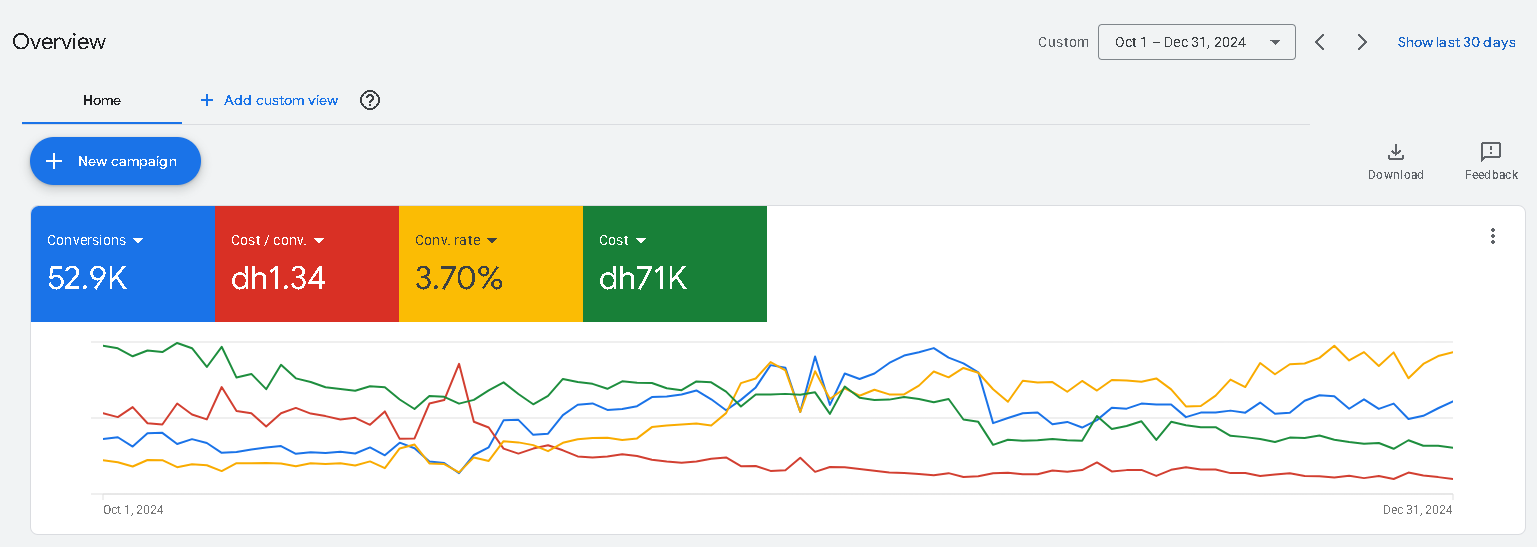
Full Google Ads overview for Q4 2024 showing 52.9 thousand conversion events at AED 1.34 each
52,885.80 recorded actions · AED 71,018.25 spend · AED 1.34 per action.
Google Ads · later period

Q3 2025

Full Google Ads overview for Q3 2025 showing 9.74 thousand conversion events at AED 4.13 each
The Q1 peak was not sustained; the supplied exports do not establish why.
GA4 · measurement gap

Q2 2025

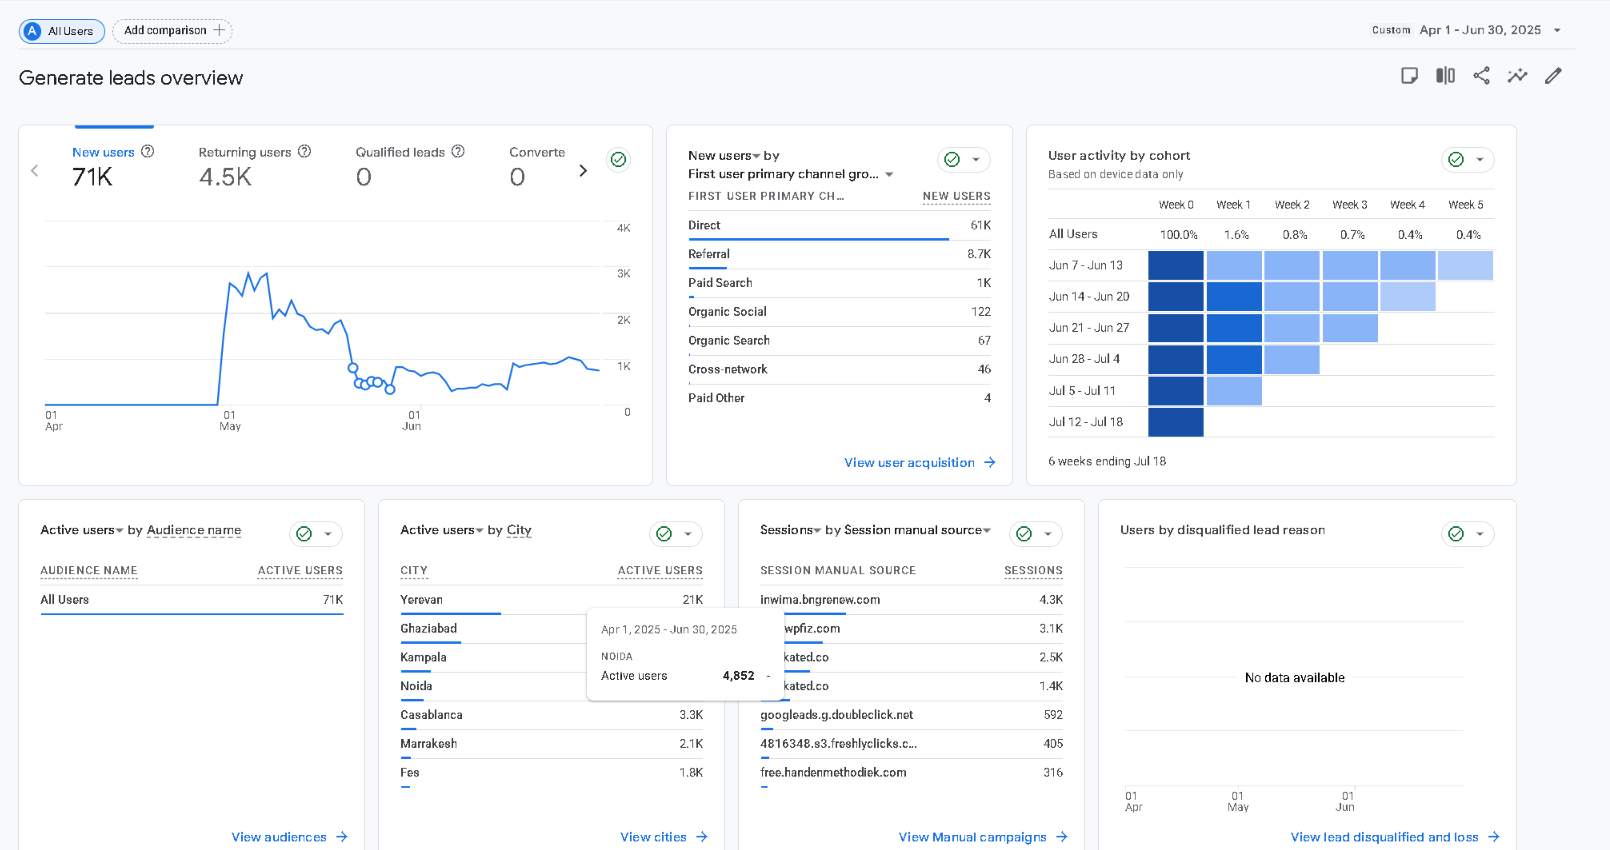
Locally obscured full GA4 Generate leads overview for Q2 2025
GA4 reported 70,615 new users but zero key events or revenue in the supplied reports.

The strongest number mattered. So did its definition, the later decline, and the missing business validation. Keeping all four visible is what makes the result useful for the next decision.

04 · The lesson

The account could answer two questions instead of hiding both inside one number.

This case does not prove revenue or a permanent performance level. It shows what becomes possible when markets, buyer journeys, landing paths, and conversion actions are separated before a platform number is treated as a scaling signal.

What this demonstrates

Separate the result before scaling the spend.

  • One job per result: consumer completion activity and B2B submit actions kept different meanings.
  • A measurable B2B path: one focused campaign, two customer-owned destinations, and one dedicated action.
  • Clear proof levels: Google Ads activity stayed separate from CRM-qualified outcomes and revenue.
  • Visible limits: the later decline remained in the story instead of being edited out.
Most relevant when

One account mixes markets, products, consumer and business audiences, or conversion goals that the wider business cannot confidently validate.

Questions a careful buyer should ask

Did 186,906 completion events mean 186,906 customers?

No. They were Google Ads-attributed events, predominantly recorded when a thank-you page loaded. They are not unique customers or sales.

Were the 265 B2B submissions qualified leads?

The evidence supports 265 platform-attributed submit actions across two owned paths. No CRM qualification or closed-revenue data was supplied.

Why compare Q3 2024 with Q1 2025?

Q3 was the first full-scale quarter and Q1 was the verified peak. Both are complete quarters; June 2024 was only a partial launch period.

Did the peak continue?

No. Account-wide events declined in Q2 and Q3. The supplied exports do not explain why, so we do not invent a cause.

What would we inspect in a similar account?

Campaign structure, spend-bearing match types, conversion actions, landing paths, GA4 attribution, and the CRM or revenue evidence used to decide what deserves budget.

Book Strategy Call