Travel Google Ads case study

We doubled recorded enquiry actions on slightly less ad spend.

An international resort group needed more travel enquiries across several destinations without letting the cost of acquisition run away. We separated the account data, checked exactly what Google counted, rebuilt campaigns around destination demand, and moved budget toward what worked. From Q2 to Q4 2025, Google Ads recorded 1,235 to 2,560 lead-form actions while spend fell 1.8%. The cost of each action fell 52.6%.

The customer
An international resort and travel group with several destinations
The problem
Expensive enquiries, fragmented account data, and unreliable analytics attribution
What we changed
Account structure, conversion checks, destination campaigns, bidding, and budget allocation
Evidence window
April 2025 to June 2026 · one verified Google Ads account

01 · The problem

More destinations created more ways to waste the budget.

The customer had two Google Ads accounts, several destinations, different campaign types, and more than one form action. A blended total could make a weak destination look healthy—or hide a strong one. GA4 also failed to show Google Ads campaign traffic clearly, so we could not use one dashboard as the whole truth.

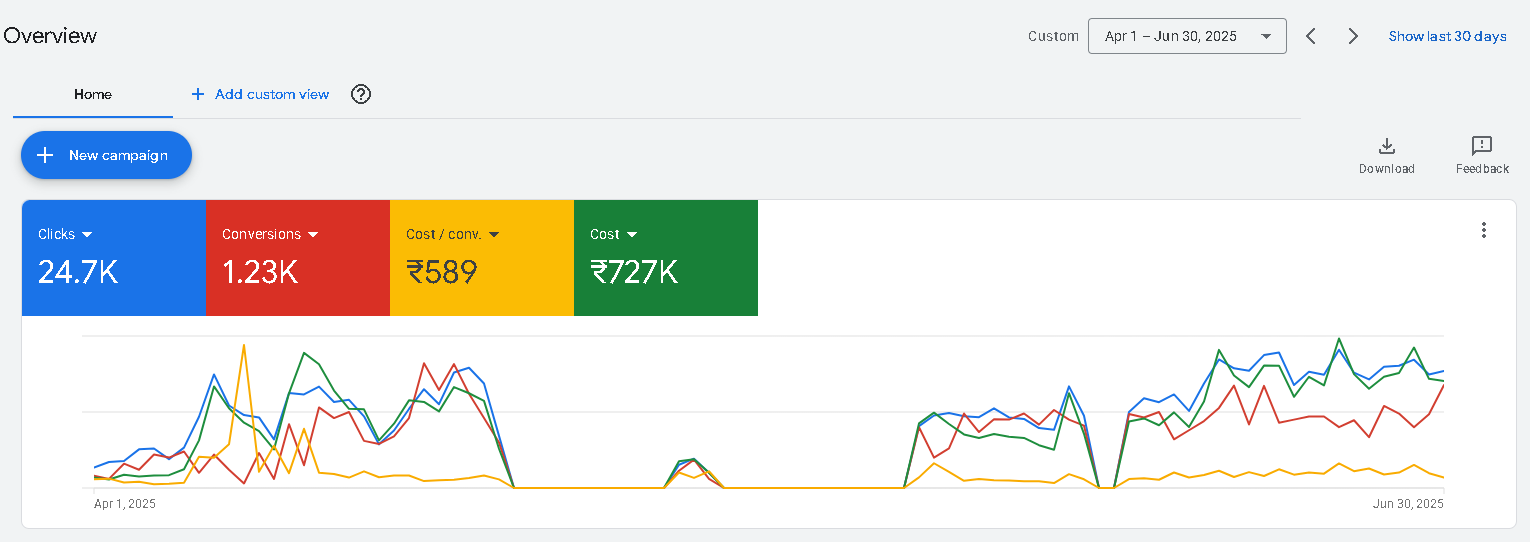
Where the account started ₹589

for each primary lead-form action in Q2 2025

Google Ads recorded 1,234.73 actions on ₹726,840.37 of spend.

Why scaling was risky 2

Google Ads accounts—we separated them before we compared results

We used only the account that matched the supplied dashboards and exports.

The measurement warning 0

paid campaigns appeared in the Q2 2026 GA4 campaign view

Google Ads reported activity, but GA4 could not independently reconcile it.

02 · What we changed

We gave every result a clear place before we scaled it.

We did not treat every click, form, destination, and account as one growth number. We separated the data, verified the primary result, rebuilt the campaign structure, and scaled only after the account showed that it could produce enquiry actions more efficiently.

  1. 01

    Separate

    Keep the two accounts apart

    We matched the screenshots, exports, campaigns, currency, and account identity. This case uses one account only.
  2. 02

    Verify

    Check what Google called a result

    We confirmed that every primary conversion in the comparison quarters belonged to the submitted-lead-form category.
  3. 03

    Rebuild

    Organise campaigns around demand

    We separated destinations, search intent, audiences, landing paths, and bidding so each part of the account could earn its budget.
  4. 04

    Scale

    Expand after efficiency improved

    We concentrated spend on proven campaigns, then broadened reach while keeping the cost per action below the starting quarter.

First, we made the same budget work harder. Then we used that stronger base to buy more reach without returning to the original cost per action.

03 · The proof

Twice the recorded enquiry actions. Slightly less spend.

We compared two complete quarters from the same Google Ads account. The conversion category stayed the same: submitted lead forms. That makes the change clear enough for a business owner to understand and strict enough for an analyst to check.

The efficiency step

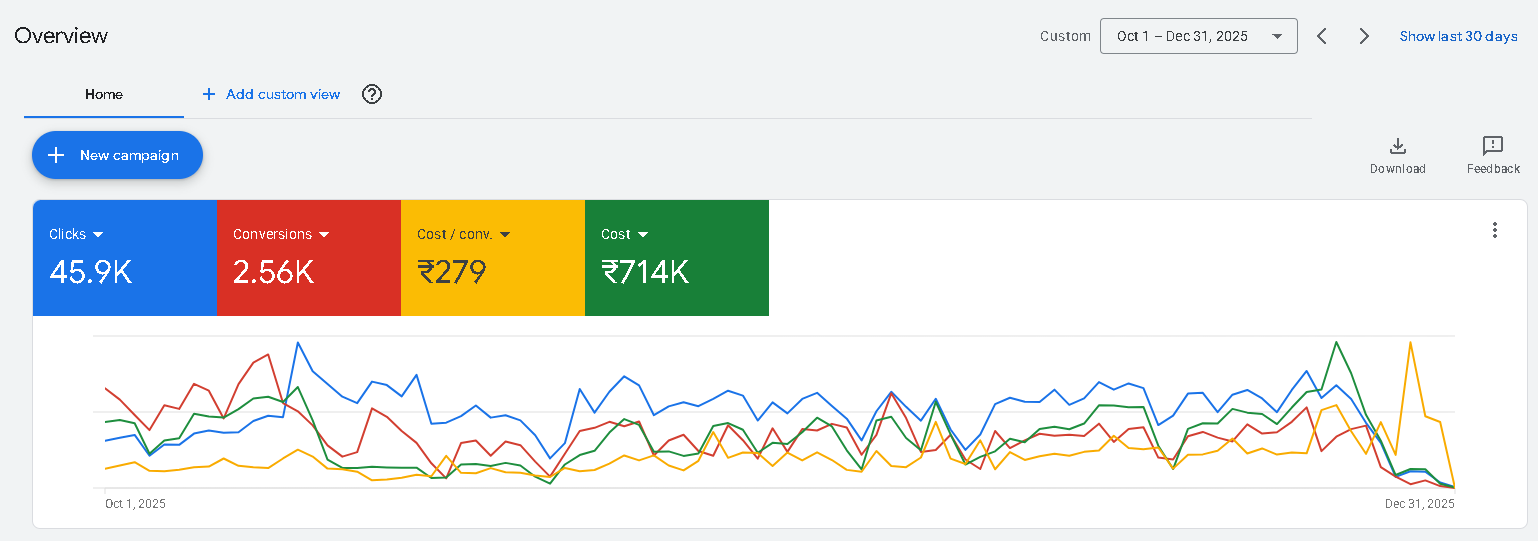
1,235 became 2,560—while spend fell by ₹13,207.

Google Ads uses attribution, so it can split credit across interactions and produce decimals. Rounded figures make the result readable; exact figures sit in the captions below.
Lead-form actions
+107.3%
Ad spend
−1.8%
Cost per action
−52.6%
Cost per action
₹589 → ₹279
Actual Google Ads dashboard

Before the efficiency step · Q2 2025

Google Ads overview for Q2 2025 showing 24.7 thousand clicks, 1.23 thousand conversions, 589 rupees per conversion, and 727 thousand rupees cost
Q2 2025 · 1,234.73 lead-form actions · ₹726,840.37 spend · ₹588.66 per action. Open full dashboard
Actual Google Ads dashboard

After the efficiency step · Q4 2025

Google Ads overview for Q4 2025 showing 45.9 thousand clicks, 2.56 thousand conversions, 279 rupees per conversion, and 714 thousand rupees cost
Q4 2025 · 2,560.20 lead-form actions · ₹713,633.05 spend · ₹278.74 per action. Open full dashboard

The scale step

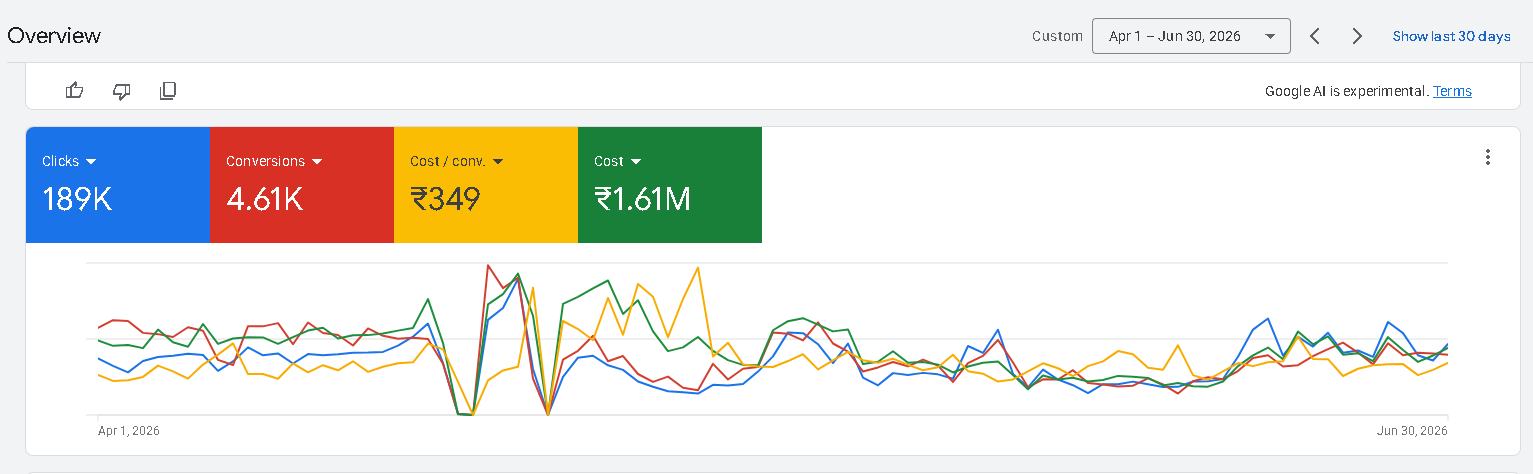
We then grew the account beyond 4,600 recorded lead-form actions in one quarter.

Q2 2026 produced 3.74× the Q2 2025 action volume. Spend rose 121.6% to support that expansion. Cost per action rose above the Q4 efficiency peak, but it remained 40.7% below the starting quarter.
Lead-form actions
4,600+
Versus Q2 2025
3.74×
Cost per action
₹349
Below starting CPA
40.7%
Actual Google Ads dashboard

The scaled quarter · Q2 2026

Google Ads overview for Q2 2026 showing 189 thousand clicks, 4.61 thousand conversions, 349 rupees per conversion, and 1.61 million rupees cost
The saved export reported 4,612.41 actions. A live recheck on 27 July 2026 reported 4,615.24 after normal attribution updates. We use “4,600+” in the story. Open full dashboard

The measurement limit

Google Analytics still could not explain the paid traffic.

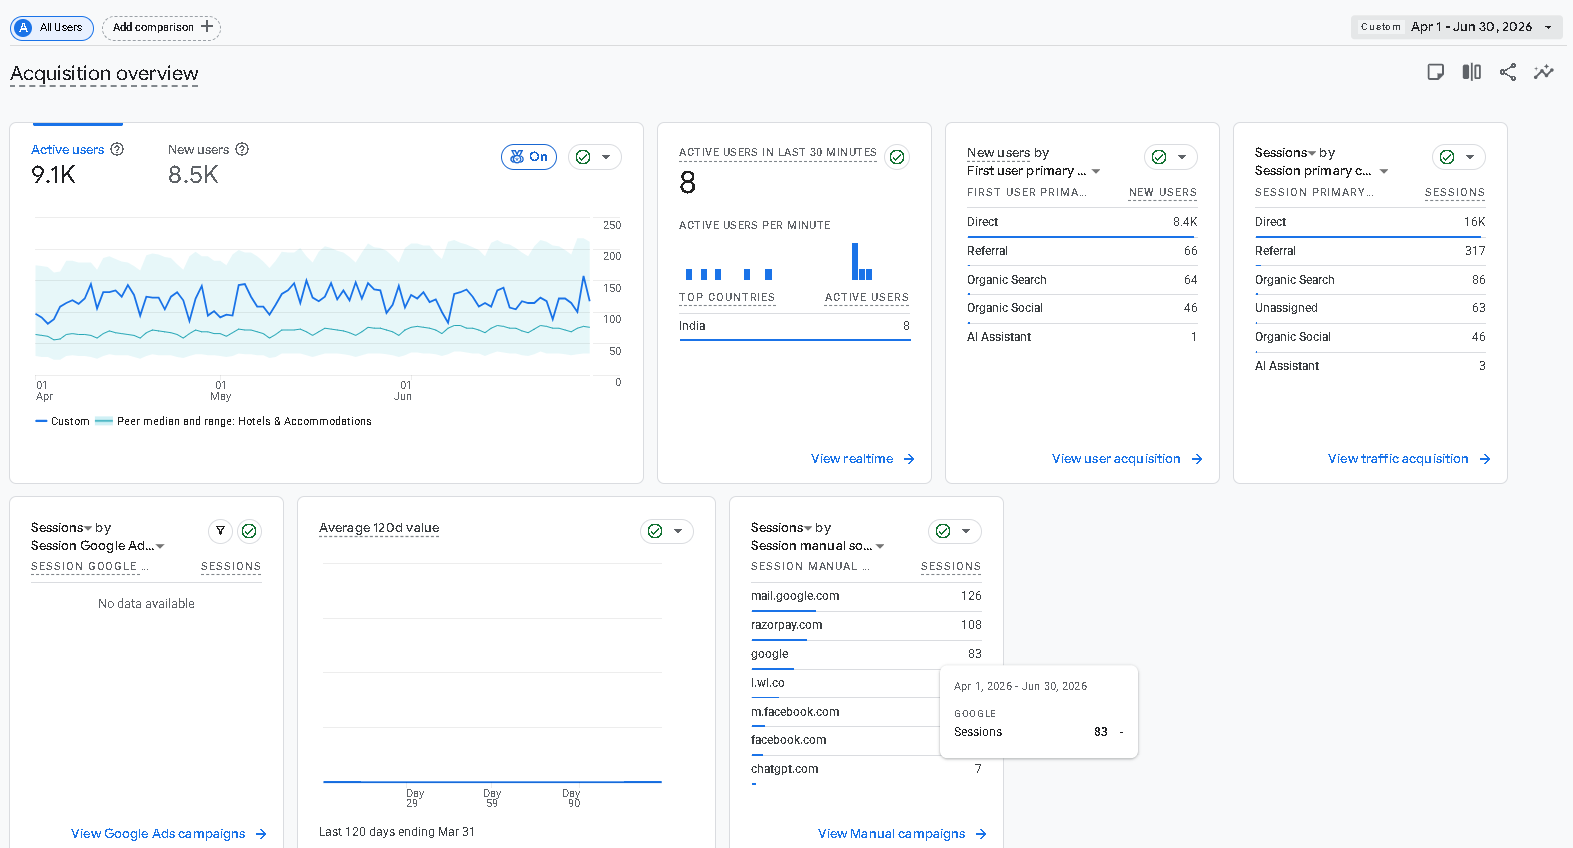
In Q2 2026, Google Ads recorded 189,443 clicks. The supplied GA4 acquisition view showed no Google Ads campaign data and zero revenue. We therefore use Google Ads to prove platform activity—not bookings, revenue, ROI, or ROAS.
Google Ads clicks
189,443
GA4 Ads campaign view
No data
GA4 revenue
₹0
ROAS claimed here
None
Actual Google Analytics dashboard

The GA4 gap that kept the claim honest

Google Analytics acquisition overview for Q2 2026 showing no data available for Google Ads campaigns
Q2 2026 GA4 acquisition overview. GA4 still failed to attribute paid campaigns in this evidence set. Open full dashboard
What these dashboards prove—and what they do not

What we can prove

  • Spend, clicks, and primary conversion actions in one verified Google Ads account
  • Every primary conversion in the comparison quarters belongs to the submitted-lead-form category
  • Q2 to Q4 2025 volume, spend, and cost-per-action changes
  • Q2 2026 scale and the cost required to support it

What we cannot prove yet

  • How many actions represent unique people or sales-qualified leads
  • How many enquiries became resort bookings or customers
  • Revenue, profit, return on investment, or return on ad spend
  • Independent GA4 confirmation of paid campaign traffic

The customer gained a larger and more efficient Google Ads enquiry engine. The next commercial step is to connect each form action to lead quality, bookings, and revenue.

04 · What it means

We made a complex travel account easier to scale and harder to misread.

The result was not one lucky campaign or one impressive dashboard total. We built a repeatable way to separate destinations, verify the action Google counted, improve efficiency, and then expand reach with clear limits around what the data could prove.

The simple answer

We turned expensive travel enquiries into controlled Google Ads growth.

  • Clear account boundary: we did not combine the customer’s two Google Ads accounts.
  • Comparable result: both proof quarters count the same primary category—submitted lead forms.
  • Efficiency before scale: we first halved cost per action, then expanded volume.
  • Honest reporting: we kept ad-platform actions separate from qualified leads, bookings, and revenue.
Best fit for

Travel and hospitality groups · Multi-location businesses · Several offers in one ad account · Rising cost per enquiry · Google Ads and GA4 disagree

Book Strategy Call