Paid Media
India · Electric mobility and RC ecommerce
We rebuilt paid growth—and helped the store keep it.
An Indian electric-mobility and RC retailer came to us at a customer-reported 1–2× ROAS. We repaired tracking, rebuilt acquisition, recovered a later dip, and reached 11.08× Google Ads platform ROAS. Shopify then revealed the next constraint: excessive sales reversals.
Google Ads · Q2 2026
11.08× platform-attributed conversion value ÷ cost- Six-month proof
- 7.71× ROAS
- Shopify reversals
- −95.7%
- Shopify net sales
- +122.7%
About the starting point: the customer reported the 1–2× range and our tracking-repair role. The dated evidence begins later, so we use the starting range as context—not as independently verified platform history.
01 · The starting constraint
We fixed the signal first.
Adding budget would have scaled a weak signal. We first traced Google Ads, GA4, Shopify, tags, conversion actions, audiences, campaigns, creative-message match, and the path from first visit to purchase.
We repaired the measurement gaps, rebuilt the acquisition structure around observed demand, and gave each funnel stage a clearer job. Only then could the customer judge whether the return was repeatable.
The next question was simple: could the account hold strong ROAS month after month?
We traced the result
We compared Ads, GA4, Shopify, tags, and conversion actions before changing spend.
We rebuilt acquisition
We aligned audiences, campaigns, creative messages, and funnel handoffs to observed demand.
We validated the outcome
We kept Google Ads attribution, GA4 behavior, and Shopify store value separate.

02 · The first breakthrough
Then we made ROAS repeatable.
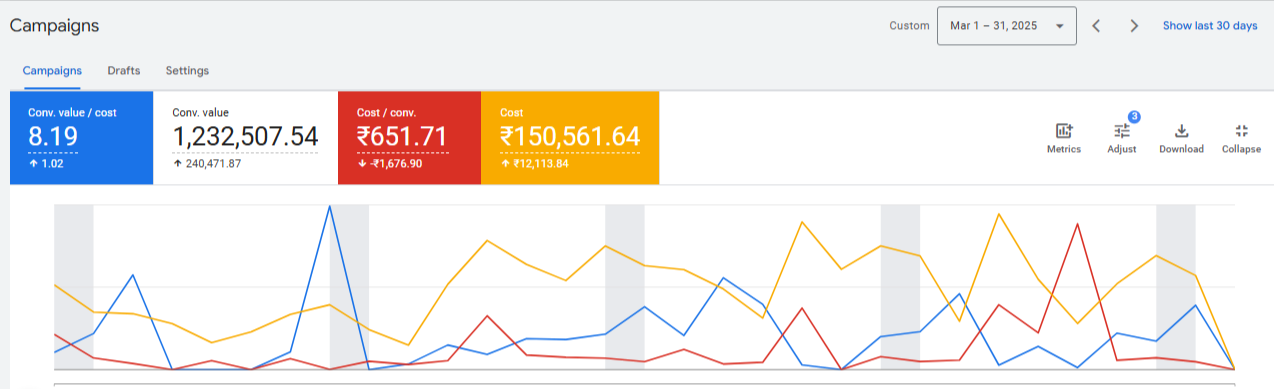
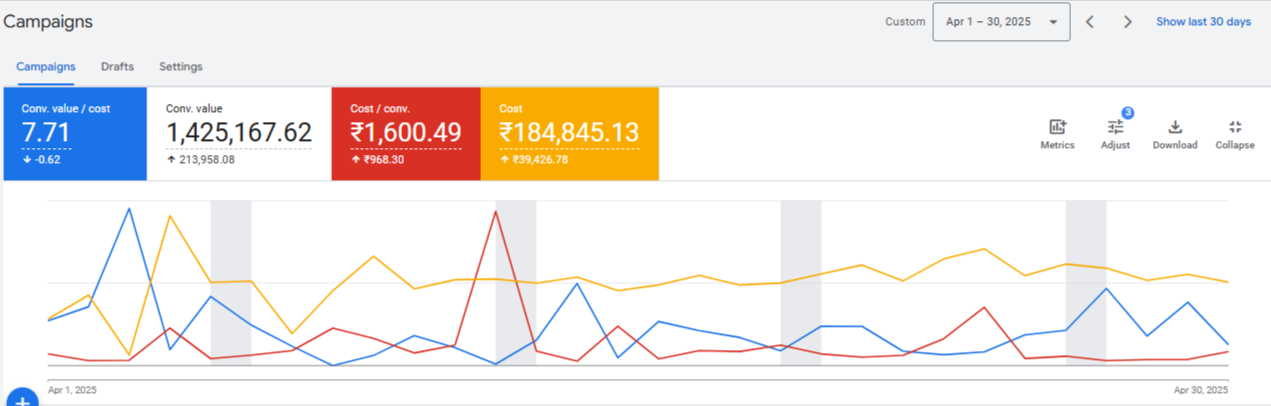
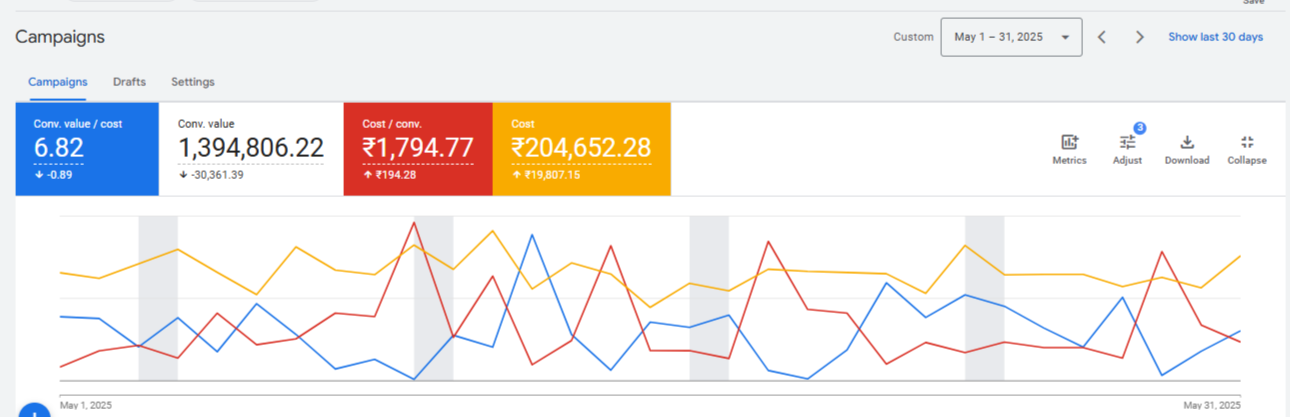
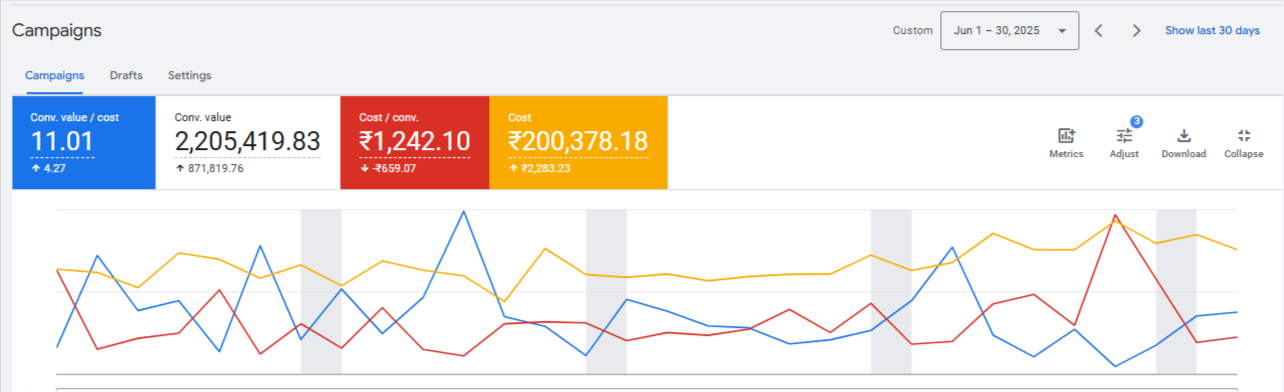
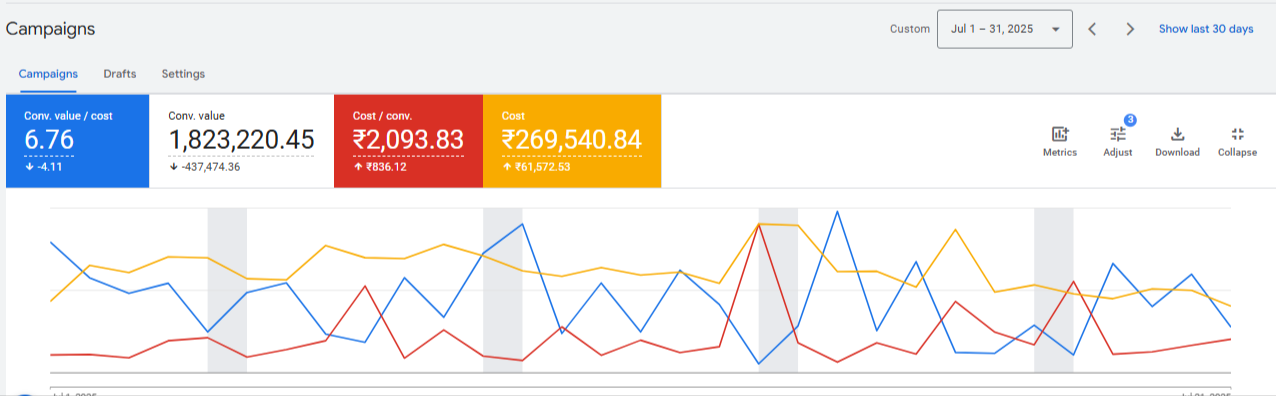
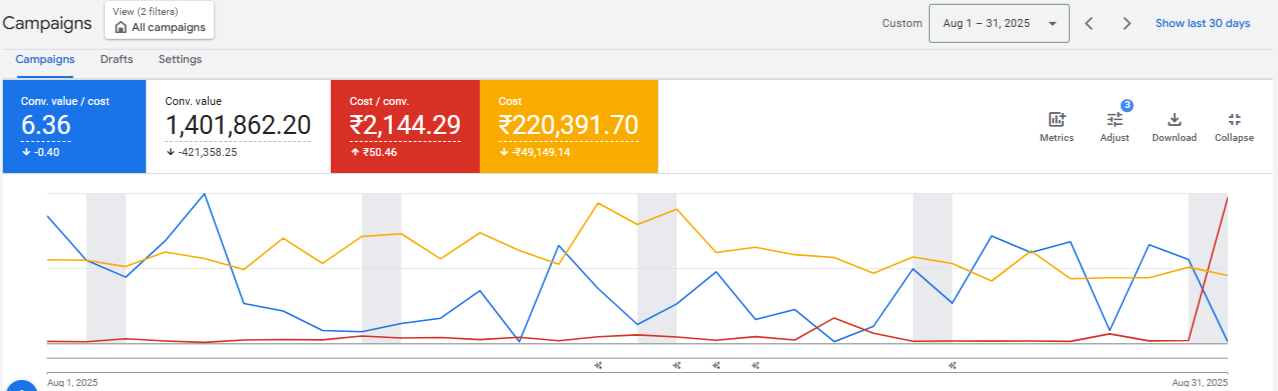
One strong month would not prove a rebuilt system. Across six dated dashboards from March through August 2025, Google Ads attributed INR 9.48M in conversion value to INR 1.23M in spend: 7.71× aggregate platform ROAS. Every captured month remained at 6.36× or above.
View the six monthly Google Ads dashboards March–August 2025 · secondary evidence +
INR 150.6K spend
INR 1.23M platform value
INR 184.8K spend
INR 1.43M platform value
INR 204.7K spend
INR 1.39M platform value
INR 200.4K spend
INR 2.21M platform value
INR 269.5K spend
INR 1.82M platform value
INR 220.4K spend
INR 1.40M platform value
03 · The recovery
When ROAS fell, we rebuilt again.
Platform ROAS fell to 4.44× in Q4 2025. We did not defend the old structure or hide the dip. We returned to the signal, re-examined the campaign split, and rebuilt around what the account was now telling us.
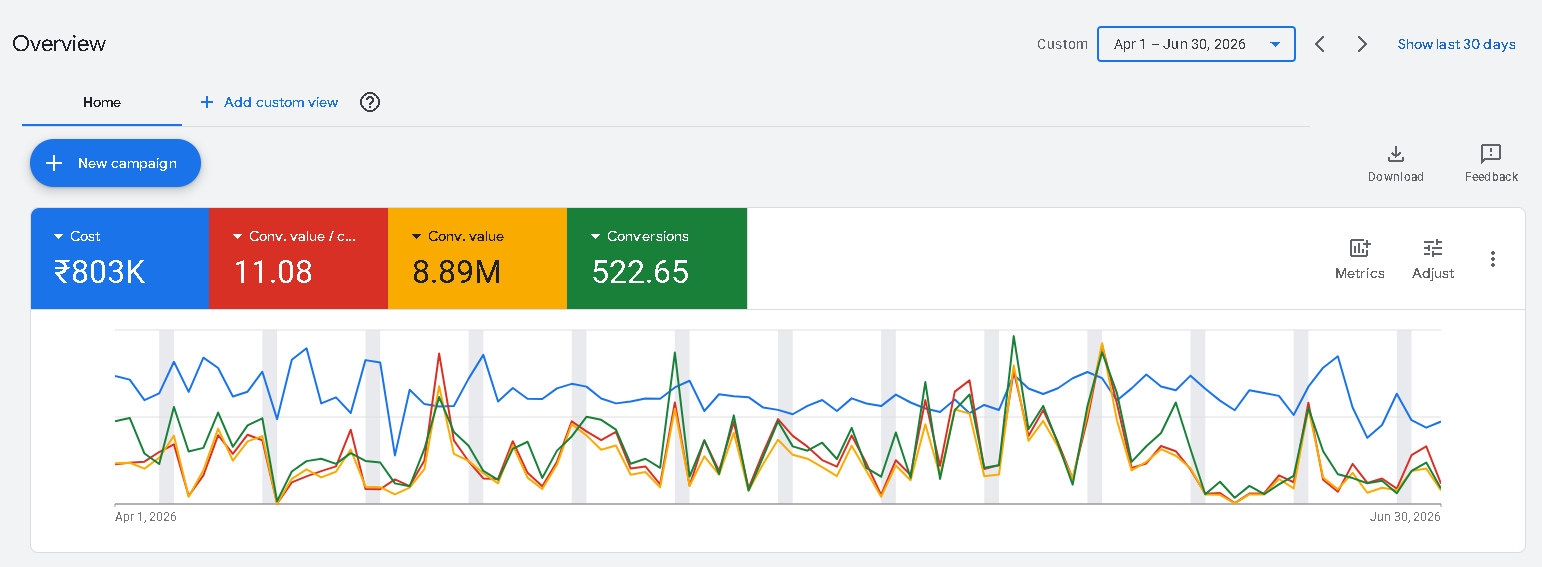
Q1 2026 recovered to 8.41×. Q2 reached 11.08×: Google Ads attributed INR 8.89M in conversion value to INR 802.5K in spend.
That solved the acquisition question. It did not answer how much value the store kept.
INR 802.5K spend
INR 8.89M platform value
04 · The next constraint
ROAS was only half the answer.
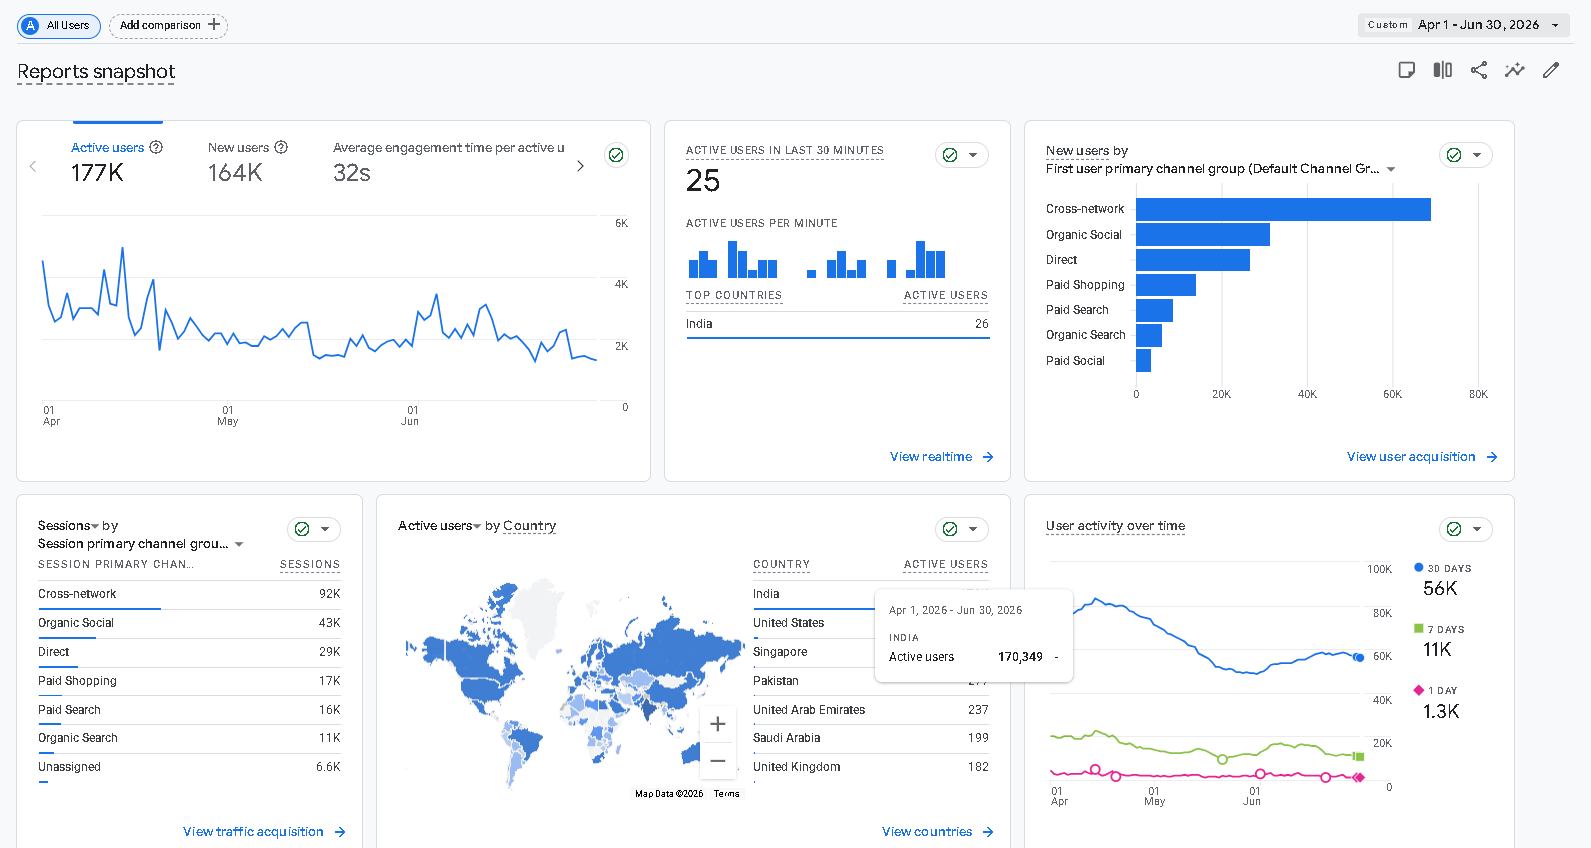
Reaching 11.08× solved the acquisition-efficiency question. It did not prove Shopify revenue, retained sales, or profit. We used GA4 to inspect how traffic arrived and behaved, then used Shopify to judge what the store actually kept.
- We checked the acquisition and measurement context in GA4
- We kept GA4 reporting separate from Google Ads attribution
- We used Shopify as the store-outcome layer
Google Ads, GA4, and Shopify answer different questions. We connected them without turning three dashboards into one invented number.
04 · Retain the value
Shopify exposed the value leak.
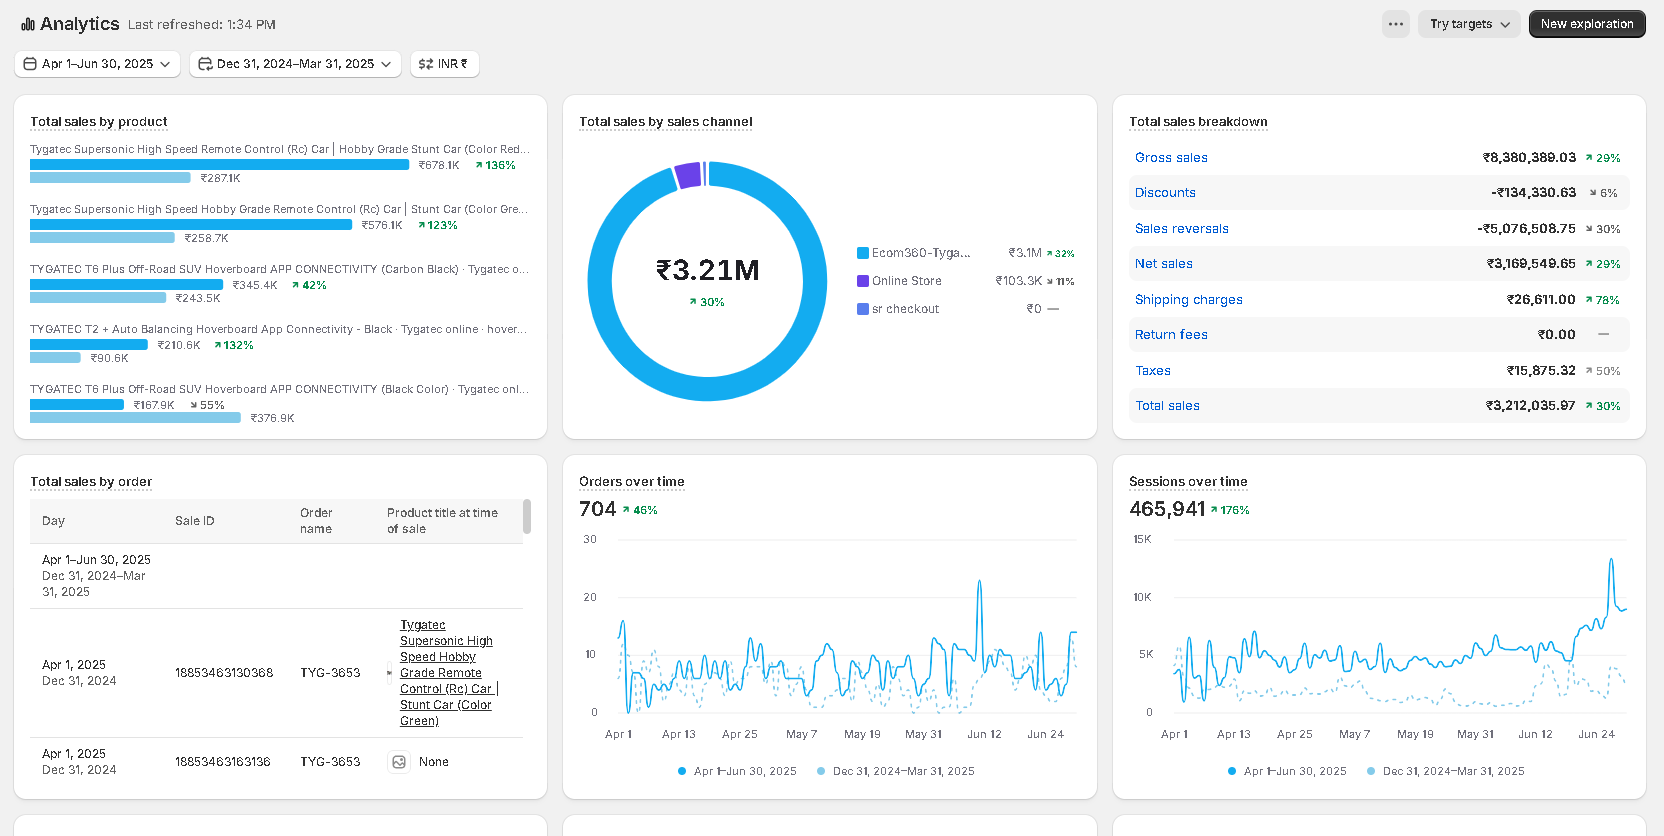
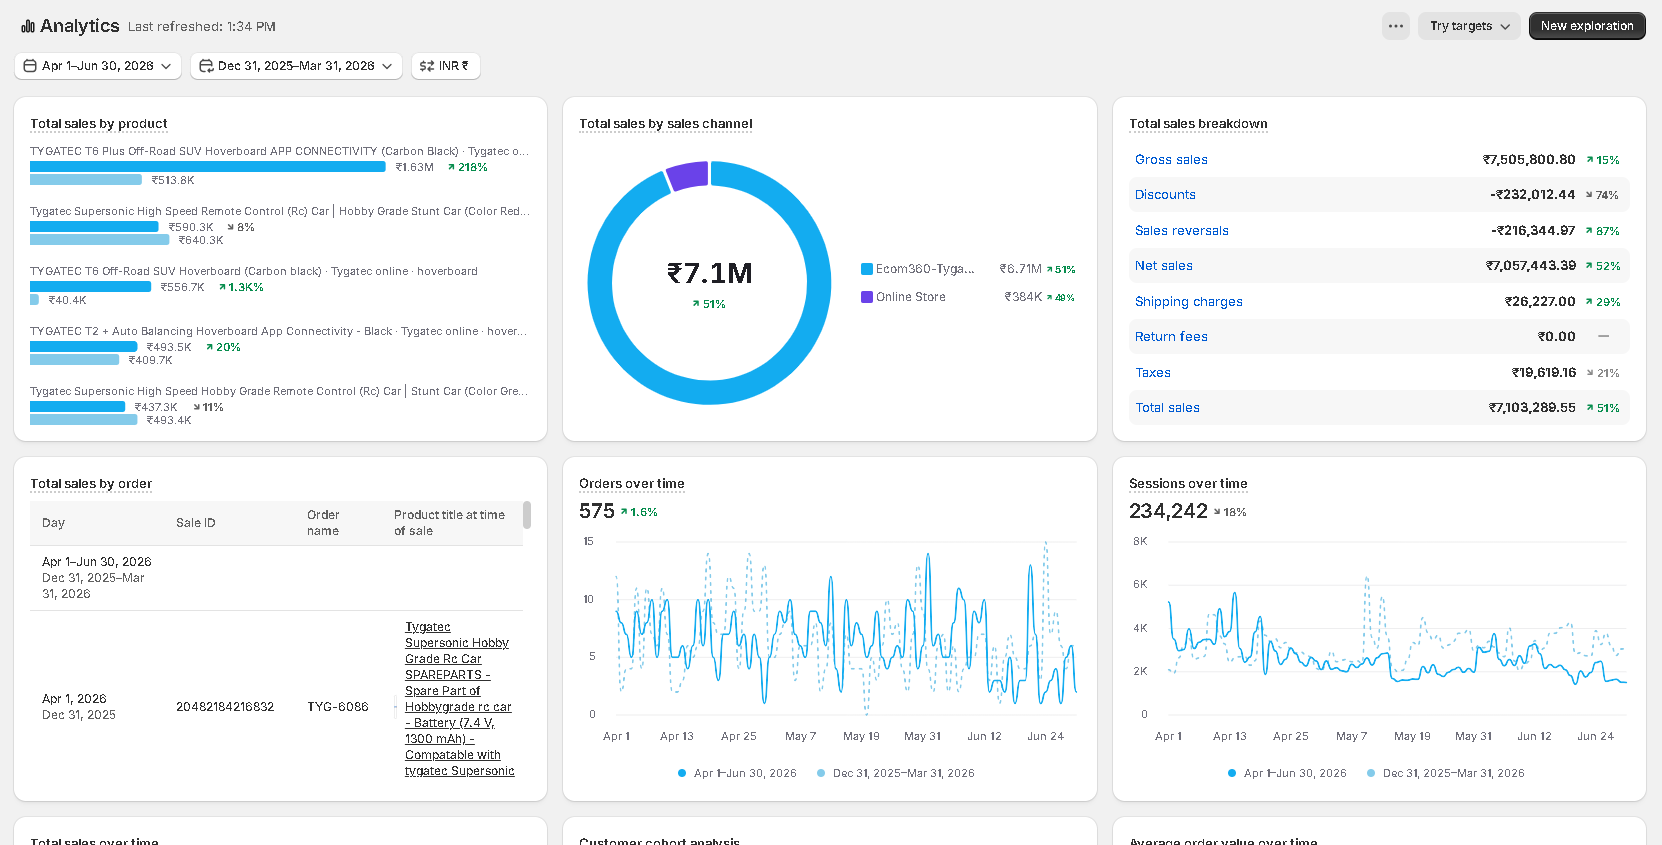
In Q2 2025, the store recorded INR 8.38M in gross sales but lost INR 5.08M to reversals, leaving INR 3.17M in net sales. By Q2 2026, Shopify recorded only INR 0.22M in reversals and INR 7.06M in net sales. The store was keeping far more of the value it created.
INR 5.08M fell to INR 0.22M
INR 3.17M grew to INR 7.06M
INR 3.21M grew to INR 7.10M
Gross sales fell 10.4%, orders fell 18.3%, and sessions fell 49.7%. The store did not win by generating more gross demand. It won by losing far less of the value it had already created. The matched Shopify periods support that store outcome; they do not isolate Google Ads as the sole cause.
What this demonstrates
We rebuilt the whole growth system.
- The customer came to us at a reported 1–2× Google Ads ROAS.
- We repaired tracking before rebuilding campaign and funnel structure.
- Google Ads recorded 7.71× aggregate ROAS across six dated monthly dashboards.
- We recovered a 4.44× quarter to 8.41× and then 11.08× platform ROAS.
- We connected Ads, GA4, and Shopify to identify the store-value constraint.
- Shopify later recorded 95.7% lower reversals and 122.7% higher net sales.
Three dashboards · three truths
We kept every result in its correct meaning layer.
- The 1–2× starting range is customer-reported context.
- Google Ads reports platform attribution—not store revenue or profit.
- GA4 provides traffic and measurement context.
- Shopify verifies the store trend, not isolated channel causality.
Questions a careful buyer should ask
What do these results actually prove?
Does 11.08× mean Shopify earned 11.08× revenue?
No. It is Google Ads conversion value divided by cost. Shopify sales and profit are separate business measures.
Is the 1–2× starting point independently verified?
No. The customer reported the starting range and our tracking-repair role. The dated dashboard sequence begins later.
Did the store grow because traffic increased?
No. Sessions, orders, and gross sales declined in the matched quarters. The supported outcome is retained-value recovery because sales reversals fell sharply.
What would we inspect in a similar store?
Tracking, conversion actions, campaign structure, audience and product segmentation, GA4 channel behavior, Shopify sales quality, and the gap between attributed and retained value.
Ecommerce growth diagnostic
Is your store keeping the growth your ads report?
Bring us your Google Ads, GA4, and Shopify data. We will identify what the platform reports, what the store retains, and which constraint must be fixed before the next budget increase.