An Indian consumer-electronics retailer came to us with Google Ads reporting 1.52×
platform ROAS. Purchase-only value/cost was just 0.25× because the account counted the
wrong commercial signals. We repaired measurement, rebuilt campaign allocation, scaled
beyond 40× platform ROAS, and then made the result answer to Shopify.
Where our contribution begins: the customer confirms that we began the
tracking repair and performance work in August 2024 at 1.52× platform ROAS. The signed
SOW formalized the relationship on 2 December; it was not the operational start.
01 · The broken signal
We fixed what the account counted.
The 1.52× headline hid a weaker commercial reality. Purchase value alone returned only
0.25× because checkout value supplied most of the platform total while another purchase
action counted conversions at zero value.
We separated purchase value from activity, repaired the measurement basis, connected
GA4, and rebuilt the acquisition structure around products and demand the customer could
actually sell.
Repairing the signal made the next question possible: could the new account structure
hold stronger return as spend increased?
Google Ads headline1.52×
INR 10.7K platform value from INR 7.0K spend
≠
Purchase-only value/cost0.25×
INR 1.7K purchase value from the same spend
01
We repaired measurement
We stopped checkout and zero-value actions from carrying the commercial story.
02
We split demand
We used Shopping and selected-product Performance Max around observed product demand.
03
We governed scale
We kept weak months visible, reallocated budget, and checked every headline against the store.
02 · The rebuild
Then we proved the rebuild could scale.
After tracking repair began, September reached 12.42× and November reached 20.02×.
January 2025 closed at 34.32×. We nearly doubled monthly spend from INR 54.4K in June to
INR 102.9K in August while retaining 27.58× platform ROAS.
Scale did not rise in a straight line. September 2025 fell to 17.32×. We kept that
regression in the record, diagnosed allocation again, and crossed 40× in January 2026.
The platform return was now unmistakably stronger. But a high Ads number still had to
survive a store-level reality check.
1.52×
Aug ’24 We entered
34.32×
Jan ’25 Rebuild held
17.32×
Sep ’25 Scale regressed
43.49×
Jan ’26 Crossed 40×
59.39×
Jun ’26 Latest month
View the complete 23-month Google Ads record August 2024–June 2026 · secondary forensic evidence +
Month
Platform ROAS
What it meant
Aug ’24
1.52×
We entered; purchase-only value/cost was 0.25×
Sep
12.42×
Tracking-repair phase
Oct
20.60×
Rebuild in progress
Nov
20.02×
Growth under our management
Dec
25.12×
SOW formalized 2 December
Jan ’25
34.32×
Scale and governance
Feb
24.07×
Selected-product PMax entered late month
Mar
29.20×
Scale and governance
Apr
21.98×
Regression kept visible
May
23.95×
Allocation review
Jun
31.40×
INR 54.4K spend
Jul
23.77×
Controlled scale
Aug
27.58×
INR 102.9K spend
Sep
17.32×
Regression kept visible
Oct
18.95×
Allocation review
Nov
36.23×
Scale and governance
Dec
33.13×
Scale and governance
Jan ’26
43.49×
First 40×+ month
Feb
34.50×
Scale and governance
Mar
30.71×
Q1 closed at 36.23×
Apr
31.06×
New PMax entered mid-month
May
54.48×
40×+ scale
Jun
59.39×
Q2 closed at 48.40×
03 · The platform-store conflict
At 36.23×, Shopify still said wait.
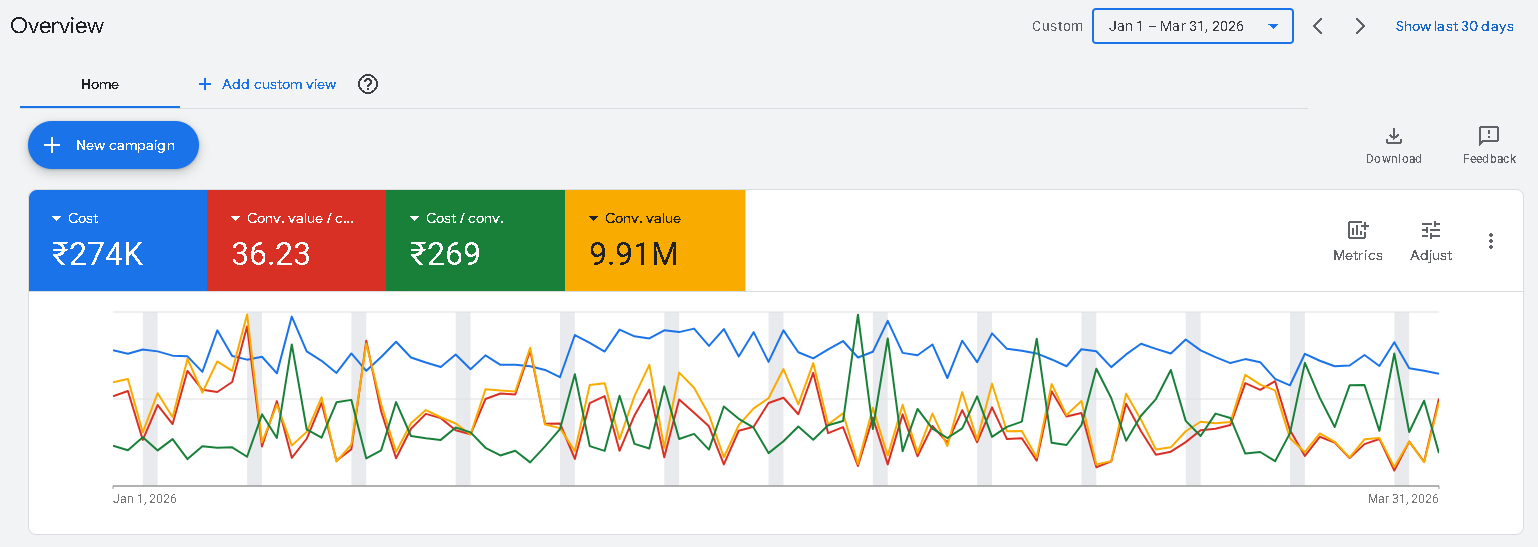
Across Q1 2026, Google Ads attributed INR 9.91M in conversion value to INR 273.5K in
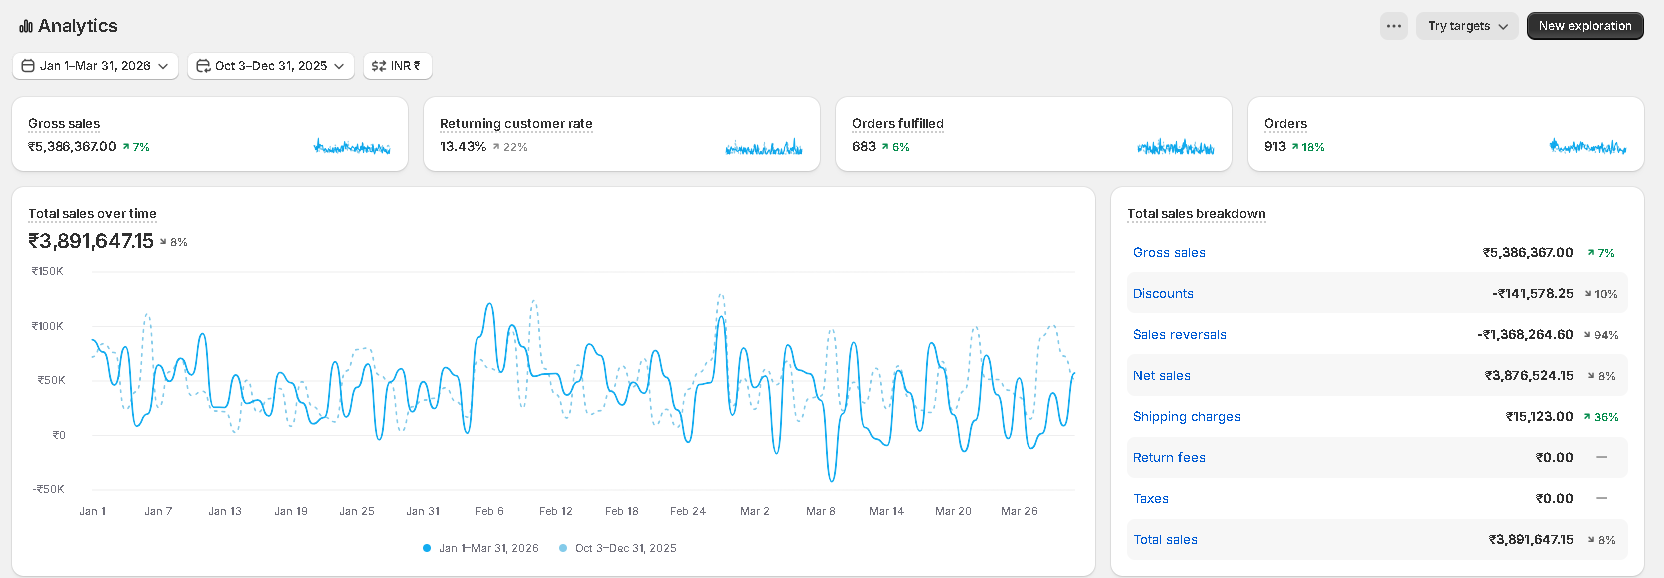
spend: 36.23× platform ROAS. Shopify recorded INR 3.89M in total sales—9.1% below the
complete Q4 2025 total.
We did not scale the largest number blindly. We treated the disagreement as the next
constraint and made Google Ads, GA4, and Shopify answer separate parts of the same budget
decision.
Google Ads · actual dashboard
Q1 2026 · 36.23×
INR 273.5K spend
Google Ads platform attribution, not Shopify revenue, profit, or business ROAS.
Shopify · actual dashboard
Q1 2026 · INR 3.89M
All-channel total sales
Q1 was 9.1% below complete Q4. The visible −8% badge uses a shifted 90-day comparison.
The easy moveScale the 36.23× headline.
→
Our moveMake attribution answer to store value.
The available evidence cannot normalize Q4 seasonality, promotions, pricing, or inventory.
We use the 9.1% decline as the decision tension—not as a seasonality-adjusted verdict.
The measurement system
We gave three dashboards three jobs.
Google Ads steered bids and campaign allocation. GA4 checked measured user and revenue
direction. Shopify judged the all-channel store outcome. We connected those sources
without collapsing them into one invented ROAS.
Google AdsBidding signal
Platform-attributed conversion value and cost
GA4Measurement check
Measured ecommerce revenue and transactions
ShopifyStore outcome
All-channel sales, orders, fulfilment, and reversals
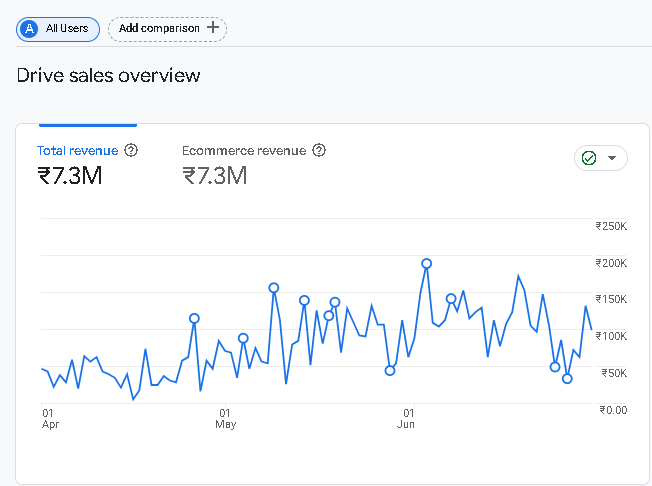
GA4 · Q2 2026 · actual dashboard
INR 7.32M ecommerce revenue
1,193 transactions
We use GA4 as a measurement cross-check—not as a substitute for Shopify store sales.
04 · The business validation
The next quarter, the store moved too.
We held Ads spend close to the Q1 run rate while a new Performance Max structure entered
in April and became a major attributed-value contributor in May and June. Google Ads
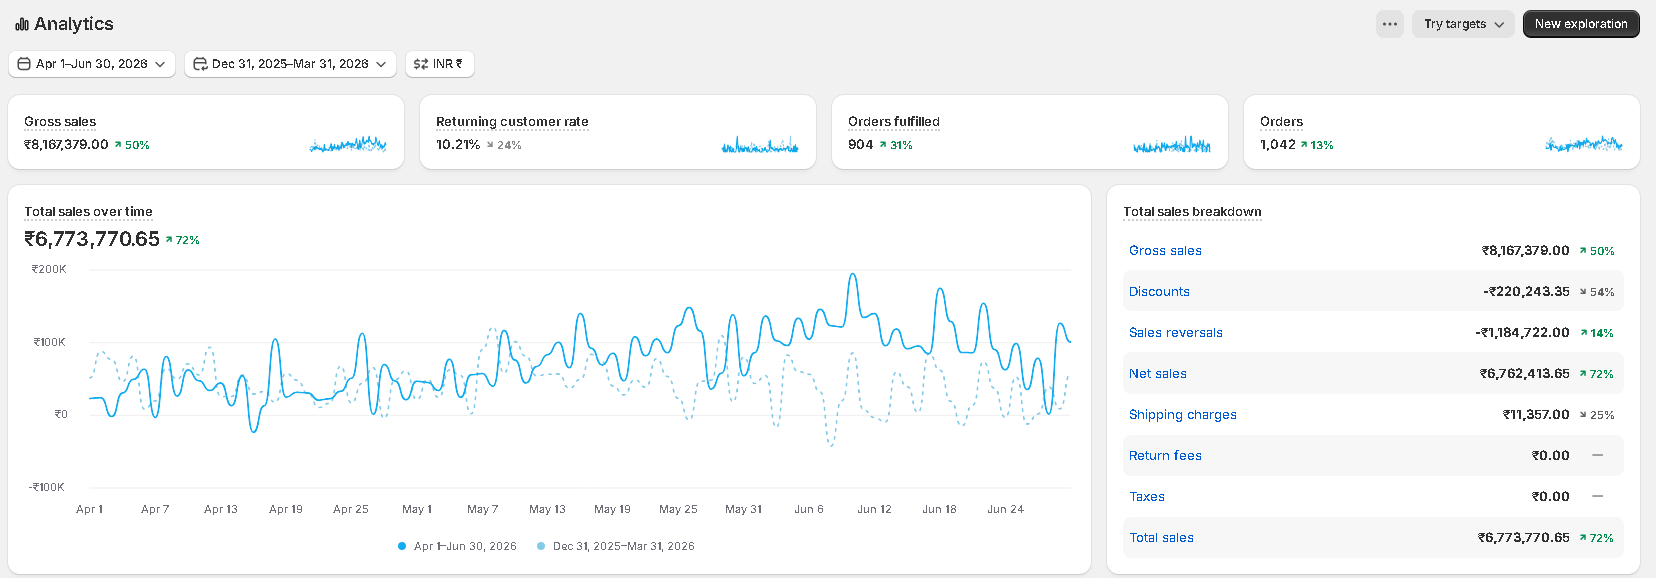
closed Q2 at 48.40× platform ROAS. Shopify total sales rose from INR 3.89M to INR 6.77M.
Google Ads spend+1.8%
INR 273.5K → INR 278.6K
Google Ads platform ROAS48.40×
Q2 2026
Shopify total sales+74.1%
INR 3.89M → INR 6.77M
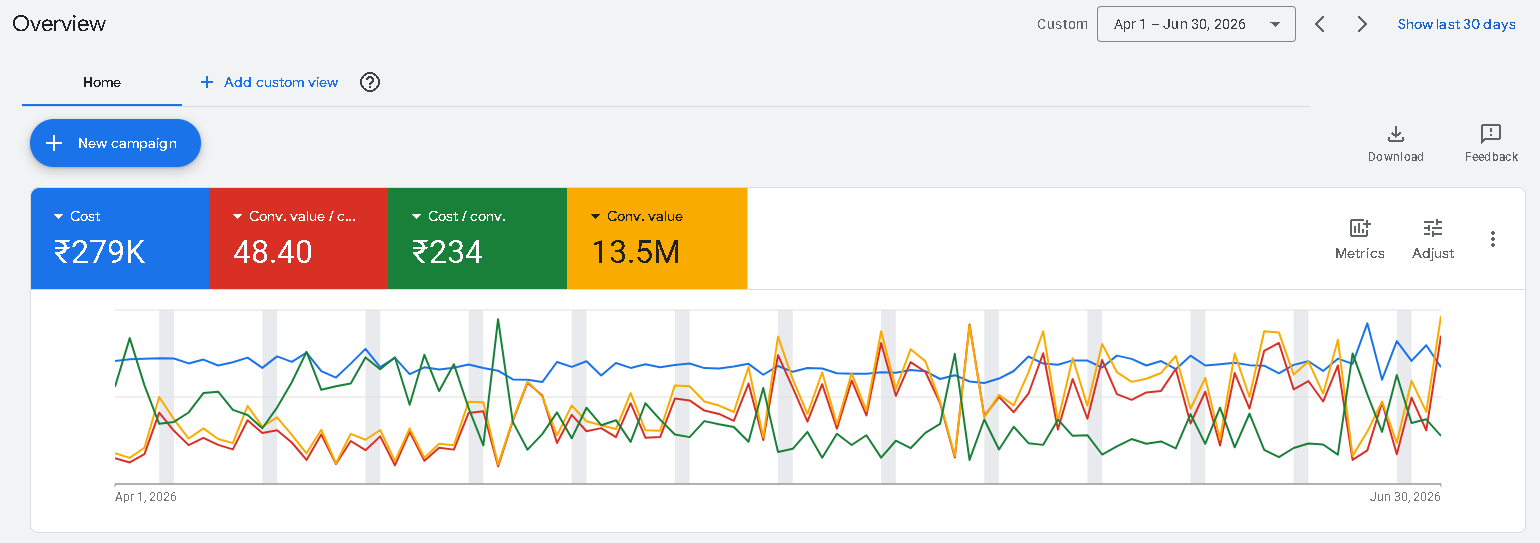
Google Ads · actual dashboard
Q2 2026 · 48.40×
INR 278.6K spend
INR 13.48M in Google Ads platform-attributed conversion value from INR 278.6K spend.
Shopify · actual dashboard
Q2 2026 · INR 6.77M
Exact Q1 → Q2: +74.1%
The visible +72% badge uses a shifted comparison. The exact calendar-quarter increase
is +74.1%.
Exact calendar-quarter comparison: Q1 versus Q2 2026
Shopify metric
Q1 2026
Q2 2026
Change
Total sales
INR 3.89M
INR 6.77M
+74.1%
Net sales
INR 3.88M
INR 6.76M
+74.4%
Orders
913
1,042
+14.1%
Fulfilled orders
683
904
+32.4%
Dashboard-reported AOV¹
INR 5,744.56
INR 7,558.98
+31.6%
Sales-reversal value
INR 1.37M
INR 1.18M
−13.4%
¹ Shopify displays the AOV figures shown, but the supplied exports do not expose the
widget’s exact denominator. Shopify is all-channel. The evidence shows co-movement; it does
not isolate how much of the store increase paid media caused.
What a similar buyer should take away
We rebuilt the whole growth decision.
The headline is not simply 1.52× to 48.40×. We first made the signal trustworthy, then
rebuilt acquisition, governed the weak months, and required Ads reporting to answer to
analytics and store value before the next budget decision.
We repaired the commercial signal before increasing budget.
We split product demand into clearer Shopping and PMax roles.
We kept regressions visible instead of presenting a perfect line.
We separated platform attribution from Shopify sales and profit.
The customer then recorded 74.1% higher Q2 Shopify sales.
Questions a careful buyer should ask
What do these results actually prove?
Does 48.40× mean Shopify earned 48.40× revenue?
No. It is Google Ads conversion value divided by Google Ads cost. Shopify sales and profit are separate business measures.
Is the 1.52× starting point verified?
The platform calculation is verified, and the customer confirms that our operational tracking and performance work began in that month. The signed SOW formalized the relationship later.
Did tracking repair create all the early ROAS lift?
No such claim is made. Repairing tracking changed what the account counted; the later campaign rebuild and allocation record show the separate performance progression.
Did 1.8% more Ads spend cause 74.1% Shopify growth?
The outcomes moved together, but the evidence does not isolate that counterfactual. We report the Shopify increase as an observed all-channel customer result.
Ecommerce growth diagnostic
Are your Ads and store numbers telling the same story?
Bring us your Google Ads, GA4, and Shopify data. We will identify what the platform
reports, what the store retains, and which constraint must be fixed before the next budget
increase.